Operations | Monitoring | ITSM | DevOps | Cloud

%term

Monitoring policy system in Pandora FMS. What they are like, what they are and where to find them

“Monitoring policy system”, “monitoring policy system”, “monitoring policy system”… As much as you repeat it, it still sounds boring, unappetizing and expensive. But you have to admit that an in-depth contact with the monitoring policy system, especially the system that concerns you, is also useful, convenient and practical after all. Therefore, to benefit you, we will start today with the policies in Pandora FMS.

How to Use Python Profilers: Learn the Basics

Serious software development calls for performance optimization. When you start optimizing application performance, you can’t escape looking at profilers. Whether monitoring production servers or tracking frequency and duration of method calls, profilers run the gamut. In this article, I’ll cover the basics of using a Python profiler, breaking down the key concepts, and introducing the various libraries and tools for each key concept in Python profiling.

The next chapter: announcing the EOL schedule for Sensu Core 1.x and Sensu Enterprise 3.x

In case you missed it, Sensu Go became generally available in December 2018, and commercial support for Sensu Go became generally available just last month. With these major milestones now in our rearview mirror, it's time to help our customers reach their own milestones of migrating from Sensu to Sensu Go.

Using Kubernetes Labels for Analytics, Forensics, and Diagnostics

Usually, when you hear us going on about labels here at Tigera, we are mentioning them as targets for selectors for network policies. As a review, you might have a policy that says, “things labeled customerDB=server should allow traffic on 6443 from things labeled customerDB=client” In this example, the labels identify a resource being produced or consumed.

BubbleUp Meets Tracing (and Other Odd-shaped Data)

A few weeks ago, BubbleUp came out of Beta. We’ve been getting fantastic user feedback on how BubbleUp helps users speed through the Core Analysis Loop and lets people find things they never could have found before. We’ve also been learning more about how BubbleUp works with Tracing, which unearthed some difficult issues. Today, we’re taking those head on.

We Tested Google Analytics vs Anodot - See Which Anomaly Detection Solution Won

A couple of months ago we released the all-new Anodot.com. Following the release, I explored our Google Analytics account to see what had happened post-launch. I have always been ambivalent about Google Analytics. On the one hand, the service has helped shape web analytics as we know it today and is used by nearly every website. Not to mention it’s free and rather easy to consume. On the other hand, GA is never a slam dunk.

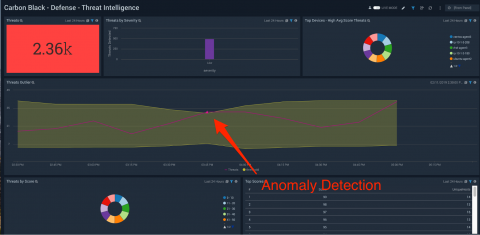
Endpoint Security Analytics with Sumo Logic and Carbon Black

As the threat landscape continues to expand, having end-to-end visibility across your modern application stack and cloud infrastructures is crucial. Customers cannot afford to have blind spots in their environment and that includes data being ingested from third-party tools.

Caching in: performance engineering in Jira Cloud

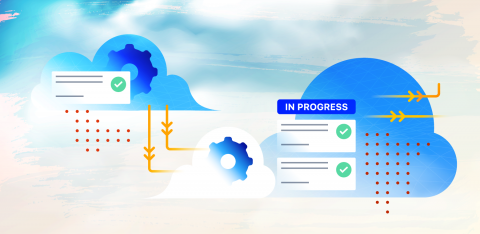
Go behind the scenes with the Jira team and see how we performance-engineered our way to a zero-affinity cloud architecture that runs at enterprise scale. Performance engineering is a big deal when you’re serving millions of users from every corner of the globe. We previously wrote about a large engineering transformation program for Jira & Confluence, which we codenamed Vertigo – read more about the overall program here.