Operations | Monitoring | ITSM | DevOps | Cloud

Why ChatOps & Incident Management are the Perfect Pair

ChatOps has become an integral part of software development and IT operations, as teams rely on automated notifications to take the place of manual alerts. In the past, if there was an alert, someone would need to manually find that notification. Then, they would have contact team members to notify them one by one so they could start working on a resolution. In this complex network of communications, it was easy to lose information, duplicate work, and simply waste time coordinating the team.

Service Profile: Activity Tab Updates

PagerDuty's new service profile enhancements allow you to better command and control incidents directly from the Service Profile. Now you can perform bulk actions on incidents like acknowledge or resolve, search by incident ID, add and view change integrations, browse resolved incidents, view related escalation policies from the service profile header, and more.

Netdata's Nodes view for troubleshooting system health and performance

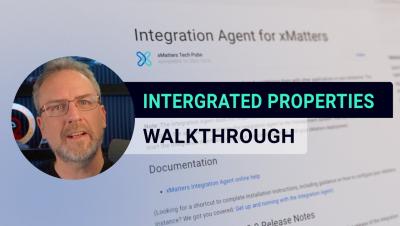
This video introduces you to the Netdata Nodes view. Use this view to visualize and customize metrics from any number of Agent-monitored nodes and navigate to any specific nodes within the dashboard. View key monitoring metrics like CPU utilization, memory usage, disk usage, network traffic, and much more to get started troubleshooting performance issues or anomalies. Netdata’s free, open-source monitoring agent works with Netdata Cloud to help you monitor and troubleshoot every layer of your systems to find weaknesses before they turn into outages.

Update on the Nobelium APT Attack Group

If you’re like me, you started your week by reading the Microsoft blog about Nobelium, an advanced-persistent-threat (APT) group that was actively targeting cloud service providers (CSPs) and managed services provider (MSPs) in a recent wave of supply chain attacks. Personally, I wasn’t terribly surprised. We all know by now that MSPs have a bullseye on them for adversaries wishing to target the supply chain. What’s different about this attack is the motive.

A guide to personal retrospectives in engineering

Retrospectives are a well-established resource in the software and systems engineering toolbox. From sprint retros through to post-incident reviews, we look back on our work to learn from it and to get better. We can apply the same ideas to our professional practice with a personal retrospective: writing an analysis of our experiences to learn as much as possible. We could look over a whole year of work, or focus more closely on a particular project.

What is Synthetic Monitoring?

Synthetic monitoring is automated testing of critical business transactions and user experiences. Synthetic monitoring helps businesses find, fix and prevent availability issues, performance issues and 3rd party vendors from giving you an insight into performance improvements that you can make to your website and supply chain to improve conversions and user happiness. Synthetic monitoring is also sometimes called user journey monitoring.