Grafana Enterprise Logs - First Look
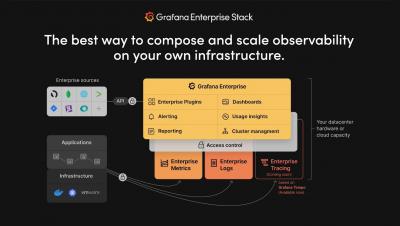
Grafana Labs just announced Grafana Enterprise Logs or GEL as part of the new Grafana Enterprise Stack. GEL is built on top of Grafana Loki and comes out of the box with enterprise-grade security, administration, and collaborative features. GEL Enables you to offer Loki-as-a-Service for your organization - on a huge scale.