Operations | Monitoring | ITSM | DevOps | Cloud

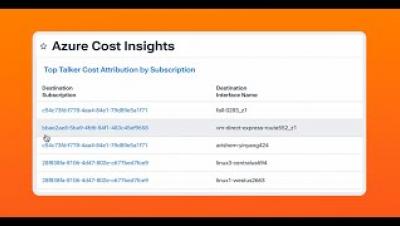
Azure Cost Attribution by Subscription with Kentik Cloud

Maximize your network efficiency and cost management with Kentik Cloud. This video shows how Kentik Cloud's custom dashboards enable you to identify the bandwidth usage associated with each Azure subscription. Learn how to accurately allocate Azure costs to individual teams or business units, and track usage-based performance issues directly to the source. Empower your organization by aligning your hybrid cloud networking with your business needs through the comprehensive insights provided by Kentik Cloud.

Troubleshooting an Azure ExpressRoute with Kentik Cloud

Learn how to effectively troubleshoot your Azure ExpressRoutes using Kentik Cloud. This video offers a step-by-step walkthrough on diagnosing problems and obtaining crucial information on your ExpressRoute traffic, including instance name, application context, and the ExpressRoute circuit name. Uncover how to filter and visualize data to see the usage of your ExpressRoutes and identify potential problems. From monitoring dropped packets to inspecting ExpressRoute metadata, see how Kentik can provide you with a wealth of real-time information to help resolve issues quickly and efficiently.

Putting the Network in Observability

With the accelerating use of DevOps and cloud-native infrastructure, observability is all the rage. Organizations, large and small, are doing their best to make sense of the logs, metrics and traces generated by their applications to identify performance and availability issues. But what about the network? It seems that many organizations forgot that network telemetry has always been the foundation of any monitoring initiative relating to performance, security, or availability. In this Techstrong Learning Experience, Techstrong Research GM Mike Rothman is joined by Phil Gervasi and Rosalind Whitley from Kentik to discuss how network observability adds depth and context to any APM or security analysis environment. Mike also highlights data from a recent network observability survey done by Techstrong Research. In this learning experience, you’ll learn.

Making the Move to Consolidation: Reducing Sprawl in 2023

For DevOps, 2023 is the year to reduce tool sprawl and start tool consolidation efforts. Sprawl is often seen as a natural result of the flexibility and empowerment of dev teams to choose their own tools, but organizations now understand the need for a single, streamlined system. While flexibility to choose the right tool for the job has enabled teams to move quickly, the result is a complex web of systems and processes to deliver software.

Unleash the Potential of Your Log and Event Data, Including AI's Growing Impact

In this Techstrong Learning Experience, Techstrong Research GM Mike Rothman and André Rocha, VP Product & Operations from ChaosSearch, will share insights from a recent Techstrong audience poll on this topic, and discuss the most pressing challenges and solutions, including the inevitable and significant impact of Generative AI.

Advice when starting a new project.

Are you getting into something new? Starting a new project, or side hustle? Awesome, that's a big step! My best advice is to get real feedback from you system and actually look at it. Look at the logs, check your analytics. See what real people do. It makes all the difference in the world, there is a lot of phantom advice out there from people who are not actually your users.

Sentry Performance: application performance monitoring built for Developers

Performance is an application monitoring platform built for developers to identify performance bottlenecks, identify their root cause, assign to the owner of the code, and fix. With workflows that trace performance issues from frontend to backend and identify exact line of code, Performance helps minimize time spent troubleshooting problems to maximize time spent coding new features.