Operations | Monitoring | ITSM | DevOps | Cloud

5 Steps to Optimizing Microsoft Teams Performance

In the fast-paced landscape of modern workplaces, efficient communication and collaboration are paramount for success. Microsoft Teams has emerged as a cornerstone tool for many organizations. However, persistent and often unseen performance issues such as poor audio or video quality can stifle productivity and have a negative impact on the customer experience. Optimizing Microsoft Teams will allow you to use the platform to its peak performance for maximum productivity.

Becoming the Office IT Hero: Put An End To "Are You Down?" Chaos

Downtime is an inevitable reality in the fast-paced world of Information Technology. When systems go offline, the pressure mounts, and colleagues begin to bombard IT professionals with the dreaded question: "Are you down?" The good news is that there's a way to transform this frustrating situation into an opportunity to shine. By implementing a Private Status Page from StatusCast, you can not only proactively communicate issues to affected employees, but also position yourself as the office hero.

Navigating GitHub Desktop: A Guide for Every OS

Git is an indispensable tool for version control, allowing devs to track and manage changes to their codebase. Alongside Git’s command-line interface (CLI), Graphical User Interfaces (GUIs) like GitHub Desktop can simplify the Git experience, making it more accessible to novice and seasoned developers alike.

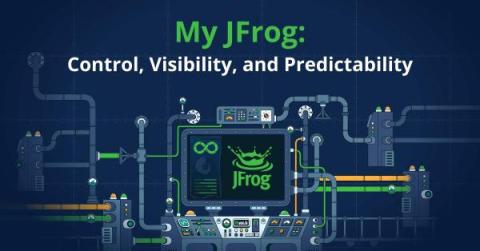
MyJFrog Portal: The Solution for Managing Your JFrog Cloud Subscription

MyJFrog is a central management portal for JFrog Platform users and administrators. It provides a single, centralized view to manage and monitor users, subscriptions, resources, and usage. This gives you the control, visibility, and predictability you need to make informed decisions about your environment. MyJFrog Portal If you have multiple JFrog Cloud subscriptions, MyJFrog lets you access and manage them all in one place. Here are just a few of the benefits of MyJFrog.

Your Practical Guide to Reducing MTTR

Let’s face it. Incidents will always happen. We simply can’t prevent them. But we can strive to mitigate the impact incidents have on our product and customers. Ensuring high reliability depends on quickly and effectively finding and fixing problems. This is where the metric MTTR, standing for “mean time to restore” or “mean time to resolve,” becomes valuable for organizations.

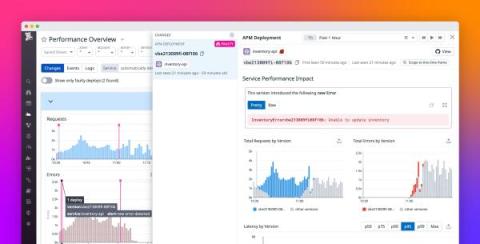
Quickly spot and revert faulty deployments with Change Overlays

Faulty deployments and other types of erroneous changes may account for around 70% of all application outages. With the prevalence of CI/CD workflows, engineering teams make changes to their applications, services, and infrastructure all the time, which can make it difficult to trace issues to specific changes.

Introducing Grafana 10.3

Grafana 10.3 is here! From improving your ability to create and navigate complex canvas panels to monitoring via anonymous access control, this release is all about enhancing efficiency and clarity in your observability journey. In this video, learn more about: Canvas Pan and Zoom Improved Tooltips Metric Analysis Alerting enhancements Multi-stack data sources Anonymous access control Stay with us through this playlist to delve deeper into each addition and maximize your Grafana 10.3 experience.

Beyond the Horizon: Actionable highlights from the 2024 MSP Horizons Report

Join N-able and Canalys, an international research firm focusing on the MSP market, for a glimpse into the future of IT with Beyond the Horizon: Actionable highlights from the 2024 MSP Horizons Report. This ground-breaking discussion covers hot-button subjects like: · Implications of changing business models· Which areas of the tech stack are primed for growth· Harnessing new developments in AI· Key business drivers for MSPs in 2024, and much more.