Operations | Monitoring | ITSM | DevOps | Cloud

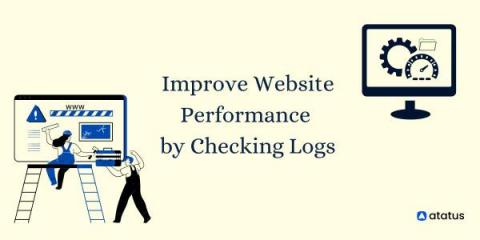
Improve Website Performance by Checking Logs

In the early days of log analysis, application developers would use their logging libraries to write logs to files stored on a disk. After years of relying on those libraries, they found that they were unable to monitor the performance of their applications anymore because they didn’t understand the way their logging libraries worked. This led to a shift from using log files stored on a disk to using Syslog.


Uncovering the mysteries of on-call

For the vast majority of organisations, some form of round-the-clock cover is critical to successful business operations. On-call is an essential part of an effective incident response process, yet there is no commonly accepted playbook on how to most effectively structure and compensate on-callers. We ran a survey to uncover the mysteries of how on-call works in organisations of different shapes and sizes around the world.

How to Locate a Device Using a MAC Address

Every device on a network has a unique address called IP address, which helps identify the device and enables other devices to communicate with it. “IP” stands for Internet Protocol. The purpose of an IP address is to handle the connection between devices that send and receive information across a network. Without an IP there is no way to establish that connection. Each IP address is a series of characters, such as “192.168.1.1”.

How Google Tracks You: The Personal Data Google Steals and Sells

Google is the most popular search engine on the planet. And there’s a good reason for that: their search service is extremely thorough, clean, and comprehensive. Need to know something just “Google it”. But there’s a catch—when you use Google to learn, Google is also learning about you.

Have fun again creating, discover visual console and dashboard editing

The visual console editor allows the user to visually design the final layout by dragging elements with the mouse, choosing the background and the icons that represent the status of each relevant aspect you want to show. With dashboards you may define screens with different created visual elements and share them with other users or display them in full screen as slides for the whole team to see.

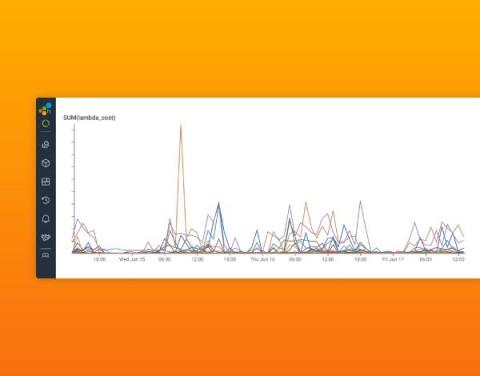
Exploring AWS Costs Beyond the Service Level

Honeycomb uses AWS Lambda as a core part of our query execution architecture; Lambda’s ability to quickly allocate lots of resources and charge us only for use is invaluable to keeping Honeycomb fast and affordable. Our total Lambda bill is easily accessible in the AWS Console, but how do we know which customers or application areas dominate this bill? How do we judge the cost of changes we make to our own software?

Tips for Optimizing React Native Application Performance - Part 2: Using Sentry SDK for Performance Monitoring

Monitoring performance in front-end applications is vital. It focuses on the areas of the application users experience. These areas are slow rendering or frame rate, network request errors, and unresponsive user experience. Your application’s users expect the experience of using the application to be fast, responsive, and smooth. In the first article of this series, we discussed some tips for optimizing your React Native application performance.

An Introduction to Synthetic Monitoring: Monitor the Uptime of your App and Critical Flows

In a world where the customer’s digital experience is critical to business outcomes, it is crucial to understand how our applications are behaving. As businesses increasingly rely on the performance and availability of revenue-generating applications, the tolerance for downtime and slow response times has plummeted – so the response to production issues must be quick and effective.