Operations | Monitoring | ITSM | DevOps | Cloud

%term

4 New Ways to Improve Incident Management with Event Orchestration

In an era where efficiency and smart technology integration are key, 71% of technical leaders report their companies are expanding their investments in artificial intelligence (AI) and machine learning (ML) this year. With the sheer volume of data coming into the enterprise and the need for timely response, monitoring every incoming alert around the clock is impractical, and human vigilance alone is too imprecise.

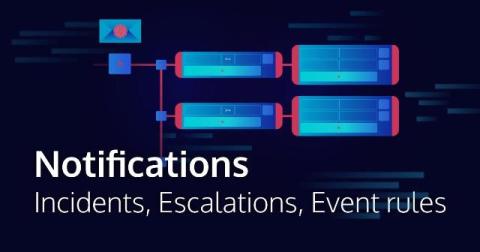
Icinga Notifications: Incidents, Escalations, and Event Rules

Following the Icinga Notifications beta announcement, we already had a more general post on how to get started and one going into the details of schedules. This week’s blog post is a follow up in this series and will describe incidents, escalations, and event rules in Icinga Notifications in more detail. In case you haven’t seen the first two referenced blog posts, you might want to have a look at them first, otherwise, you could miss out on the big picture.

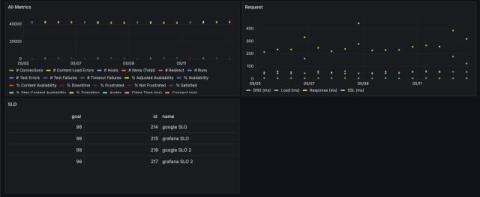
The Catchpoint Enterprise data source for Grafana: key features and how to get started

Earlier this year, we were thrilled to announce that Catchpoint is now available as an Enterprise data source for Grafana! With the public preview release of the Catchpoint Enterprise data source, you can seamlessly bring Catchpoint’s extensive Digital Experience Monitoring (DEM) and Internet Performance Monitoring (IPM) capabilities into your Grafana dashboards, enhancing your ability to visualize and analyze performance metrics in real-time.

Optimize your costs with lowcode & nocode capabilities

Ivanti finds, heals, and protects every device, everywhere – automatically. Whether your team is down the hall or spread around the globe, Ivanti makes it easy and secure for them to do what they do best. Ivanti is IT for the way we work now. Integrated solutions for everything IT touches. So, employees can work better, anywhere, and everywhere. Exceptional employee experiences Any device. Any location. Ensure proactive, efficient service so employees can work how they want.

New Relic vs Splunk - In-depth Comparison [2024]

New Relic and Splunk are two prominent tools in the world of observability and monitoring, each serving distinct purposes. New Relic is used for Application Performance Monitoring (APM), offering a full-stack observability platform. It is important to note that New Relic is not a SIEM tool, its primary focus is performance monitoring. On the other hand, Splunk is used for log management, machine data analytics, and is widely utilized as a SIEM tool.

Mastering Null Semantics: Translating SQL Expressions to OpenSearch DSL

Working at Coralogix, a leading full-stack observability platform, I recently faced an interesting challenge. The team I am part of is building the DataPrime query language and query engine, used to easily query logs and other observability data on the platform, usually in the form of Parquet files on AWS S3. Inside the engine, our DataPrime queries are transformed into query plans with SQL-like expressions, for example in filters.