Operations | Monitoring | ITSM | DevOps | Cloud

New Browser APIs for Detecting Javascript Performance Issues in The Production

Users nowadays demand the greatest possible experience, which implies top-notch performance. Smooth scrolling, prompt interaction responses, a fast page load time, and flawless animations are all things they anticipate. Local profiling to identify performance issues is convenient, but it only provides a limited amount of information. While things may run smoothly on our high-end developer machines, the user may be dealing with poor hardware and a bad experience.

Rust - Implementing OpenTelemetry in a Rust application for performance monitoring

In this tutorial, we will use OpenTelemetry to instrument a PHP application for telemetry data. OpenTelemetry can be used to trace Rust applications for performance issues and bugs. OpenTelemetry is an open-source project under the Cloud Native Computing Foundation (CNCF) that aims to standardize the generation and collection of telemetry data. Telemetry data includes logs, metrics, and traces. More about SigNoz.

Recommended AppSignal Setup

We're launching our new Getting Started page. This feature helps first-time users to set up their monitoring with AppSignal, as soon as they've signed up. Before we dive in, we'd love to share our beliefs about onboarding. All developers share these same “first-time” moments: Many of our customers start monitoring their applications for the first time with AppSignal, or experience new types of issues when scaling an application.

5 Essential ITAM KPIs You Should Be Tracking

In any organization, IT Asset Management (ITAM) is one of the key processes necessary to ensure the continued delivery of IT services. Efficient asset management ensures that both hardware and software assets are available at the least cost to the organization. Through routine updates and upgrades, asset management ensures that the assets don’t face unnecessary or unexpected downtime. You can also reduce IT security risk with asset management.

An Introduction to Windows Event Logs

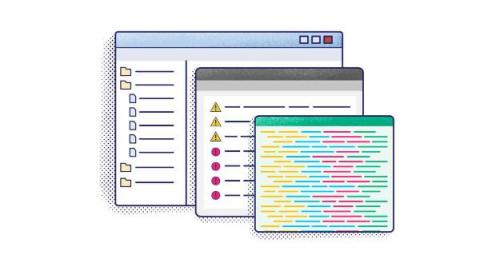
The value of log files goes far beyond their traditional remit of diagnosing and troubleshooting issues reported in production. They provide a wealth of information about your systems’ health and behavior, helping you spot issues as they emerge. By aggregating and analyzing your log file data in real time, you can proactively monitor your network, servers, user workstations, and applications for signs of trouble.

GrafanaCONline 2022 Day 2 recap: Grafana 9, Grafana Mimir, Grafana Tempo demos, new hackathon projects, and more

The excitement around GrafanaCONline 2022 continues to soar after another day filled with demos of new features and functionalities in Grafana 9, Grafana Mimir, and Grafana Tempo. Plus we learned how a mini arcade turned into a Grafana display; how Grafana transformed into a health tracker, and how, yes, Grafana can run Doom.

How low-level API calls can stabilize your end-to-end tests

We’re heavy end-to-end monitoring users here at Checkly and always experiment with how to architect our tests the best way. Over the past months, we’ve settled on a few workflows that make it much easier to spin up new tests, avoid code duplication, and make the entire test setup easier to manage. One of those strategies is to strictly separate concerns in our tests.

Announcing Logz.io Alert Manager for Metrics

Logz.io alerts are a critical capability for our customers monitoring their production environment. By keeping a watchful eye for data that indicates an issue – like spiking memory metrics or 3xx-4xx response codes – alerting quickly notifies engineers that something is going wrong. Setting an actionable alert to immediately notify engineers of oncoming problems can be the difference between a minor issue and a major event with widespread customer impact.