Operations | Monitoring | ITSM | DevOps | Cloud

%term

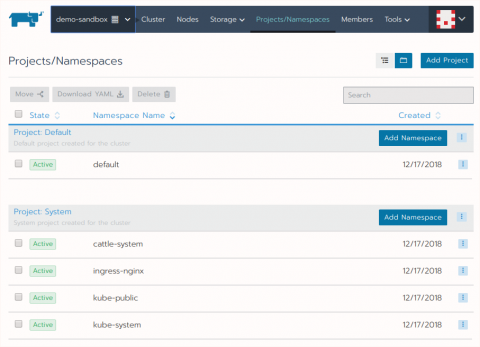
Introduction to Kubernetes Namespaces

Kubernetes clusters can manage large numbers of unrelated workloads concurrently and organizations often choose to deploy projects created by separate teams to shared clusters. Even with relatively light use, the number of deployed objects can quickly become unmanageable, slowing down operational responsiveness and increasing the chance of dangerous mistakes.

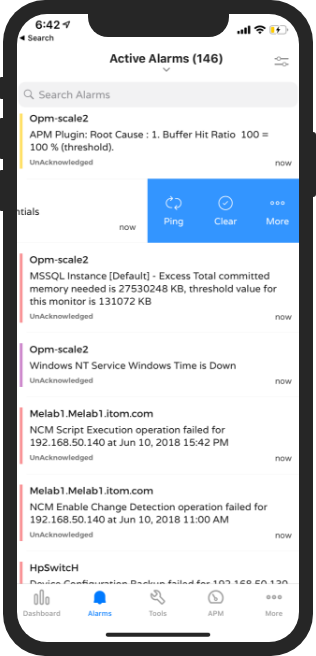
Become an eagle-eyed network admin using OpManager's push notifications

The secret to exceptional network management is periodically identifying and diagnosing network problems. Putting your experts at the network operations center (NOC) all day watching for a device to go down isn’t the best use of your workforce’s time. There has to be a smarter way to view potential network pitfalls without being glued to the chair in your NOC.

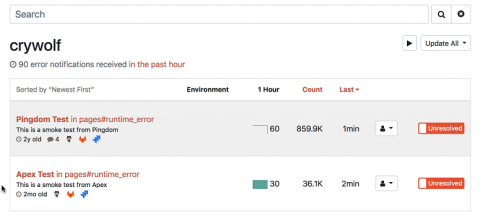
Announcing Search Autocomplete

Stop the presses! We've just added a small but really cool new feature to your Honeybadger account: search key autocomplete. You've always been able to search your errors by params, session and other nested fields. It's easy to find all errors where params.user.name is bob. But there's a catch. You had to know beforehand that params.user.name exists, and you had to type it in manually. This made it really difficult to do on-the-fly exploratory searches.

Zero Trust Security: Supporting a CARTA approach with Network Security

Learn how to support, what Gartner has termed, a continuous adaptive risk and trust assessment (CARTA) when building a CaaS platform using Kubernetes. Network security enables microsegmentation and is a core component of a zero trust security model. It allows you to protect your workloads against threats without relying on assumptions about the network, infrastructure, and workloads.

timeShift(GrafanaBuzz, 1w) Issue 77

We’ve added more info on the upcoming talks at GrafanaCon LA and are excited to see the schedule shaping up. Grab your ticket while the last and join us February 25-26 for two days of great talks and hands-on workshops. This week we’re happy to share articles on how to view Azure Monitor Log Analytics data in Grafana, a proof of concept to visualize Fitbit data, how to quickly get up and running with Prometheus and more.

2018 year in review

There were some big IT headlines this past year. Microsoft acquired GitHub and IBM bought Red Hat. Kubernetes graduated from the CNCF incubator program. And the biggest headline of all—at least to those of us at Datadog, where we live and breathe monitoring—we released Datadog Agent version 6, a completely new monitoring agent written in Go! As we start the new year, we’d like to take a moment to recognize some of the incredible things our engineers accomplished in 2018.

LM Unleashed: 2019 Global Kick-off

Last week, the LogicMonitor executive staff kicked off a global tour across the LM offices to celebrate 2018 wins and share the company vision moving into 2019. This annual Company Kick-Off event (CKO) remains a strong tradition here at LogicMonitor, allowing team members to celebrate, collaborate and fuel-up for success in the coming year.