Operations | Monitoring | ITSM | DevOps | Cloud
July 2021
Splunk Mobile - Overview (in 60s)
Splunk Mobile - Dashboards (in 60s)
Splunk Mobile - Backend Summary (in 60s)
Splunk Cloud Monitoring Console on Mobile (in 60s)
Splunk On-Call prevents and cuts downtime episode length by half
How to Maximize the Performance of Your Kubernetes Deployment
With Kubernetes emerging as a strong choice for container orchestration for many organizations, monitoring in Kubernetes environments is essential to application performance. Poor application/infrastructure performance impact in the era of cloud computing, as-a-service delivery models is more significant than ever. How many of us today have more than two rideshare apps or more than three food delivery apps?
Conti Threat Research Update and Detections
The Splunk Threat Research team has researched two of the current payloads involved in these heinous campaigns against healthcare and first responder organizations such as Conti & REvil. In the first blog, we explored the REvil ransomware group and in this blog, we will explore Conti.
Splunk SOAR Feature Video: Create a Manual Event
Splunk SOAR Feature Video: Configure Third Party Tools
Splunk SOAR Feature Video: Install/Update Apps
Detecting SeriousSAM CVE-2021-36934 With Splunk
SeriousSAM or CVE-2021-36934 is a Privilege Escalation Vulnerability, which allows overly permissive Access Control Lists (ACLs) that provide low privileged users read access to privileged system files including the Security Accounts Manager (SAM) database. The SAM database stores users' encrypted passwords in a Windows system. According to the Microsoft advisory, this issue affects Windows 10 1809 and above as well as certain versions of Server 2019.
Splunk SOAR Feature Video: Custom Functions
Splunk SOAR Feature Video: Contextual Action Launch
Splunk SOAR Feature Video: Investigation Command Line
Onboarding Data in Splunk Security Analytics for AWS
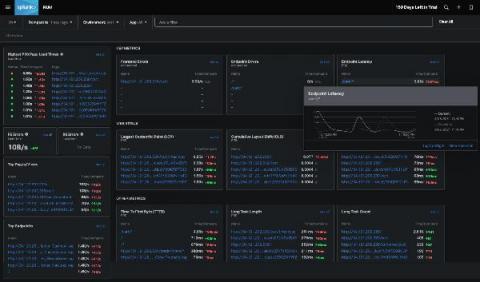
With Splunk Synthetic Monitoring, proactively find and fix your user experience issues
Go beyond basic uptime and performance monitoring with Splunk Synthetic Monitoring
Get Started with Splunk for Security: Splunk Security Essentials
Continuing to ride the waves of Summer of Security and the launch of Splunk Security Cloud, Splunk Security Essentials is now part of the Splunk security portfolio and fully supported with an active Splunk Cloud or Splunk Enterprise license. No matter how you choose to deploy Splunk, you can apply prescriptive guidance and deploy pre-built detections from Splunk Security Essentials to Splunk Enterprise, Splunk Cloud Platform, Splunk SIEM and Splunk SOAR solutions.
Prioritize and resolve performance defects with Splunk Web Optimization
Detect any issue with Splunk APM before it turns into a customer problem
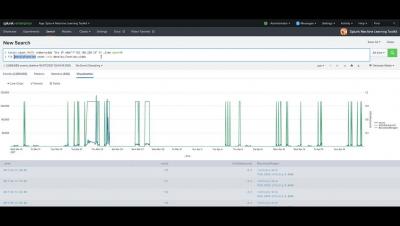
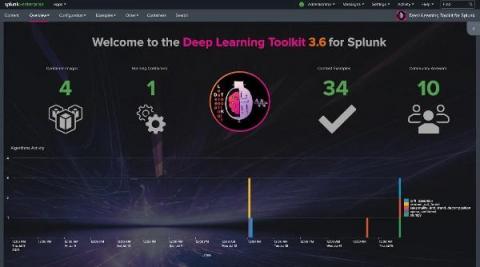
Deep Learning Toolkit 3.6 - Automated Machine Learning, Random Cut Forests, Time Series Decomposition, and Sentiment Analysis
We’re excited to share that the Deep Learning Toolkit App for Splunk (DLTK) is now available in version 3.6 for Splunk Enterprise and Splunk Cloud. The latest release includes: Let’s get started with the new operational overview dashboard which was built using Splunk’s brand new dashboard studio functionality which I highly recommend checking out. You can learn more about it in this recent tech talk which you can watch on demand.
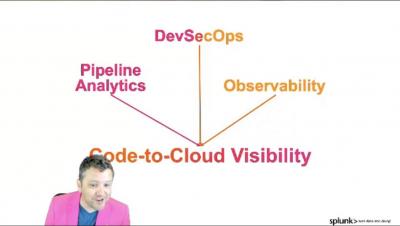
Dissecting DevOps - Code-to-Cloud Visibility: The Framework for DevOps Success
Detecting Trickbot with Splunk
The Splunk Threat Research Team has assessed several samples of Trickbot, a popular crimeware carrier that allows malicious actors to deliver multiple types of payloads.
How to Instrument a Java App Running in Amazon EKS
As we start to see big moves from monolith deployments to microservices, the adoption of Kubernetes has become top of mind for many SREs. Organizations can leverage the open-source system to automate deployments, scale, and manage containers, making Kubernetes one of the primary solutions for delivering workloads. However, maintaining the system can be difficult and, in some cases, overwhelming.
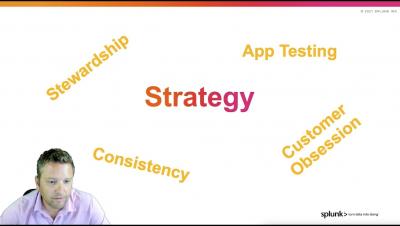
Dissecting DevOps - Measuring quality in a SaaS world: SLA, SLI, SLO
Taking Inventory of Your Google Cloud
Splunk Cloud Architect Paul Davies recently authored and released the GCP Application Template, a blueprint of visualizations, reports, and searches focused on Google Cloud use cases. Many of the reports included in his application require Google Cloud asset inventory data to be periodically generated and sent into Splunk. But HOW exactly do you craft that inventory generation pipeline so you can "light-up" Paul's application dashboards and reports?
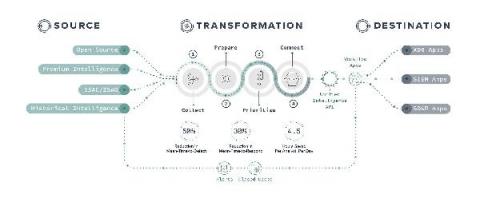
API 2.0: TruSTAR Operationalizes Data Orchestration and Normalization for a New Era in Intelligence Management
Today we released API 2.0, the latest version of TruSTAR’s API-First Intelligence Management Platform. This new version continues our commitment to simplify and streamline intelligence for automation in enterprise security intelligence management, and breaks through long-standing industry limitations around operationalizing data orchestration and normalization.
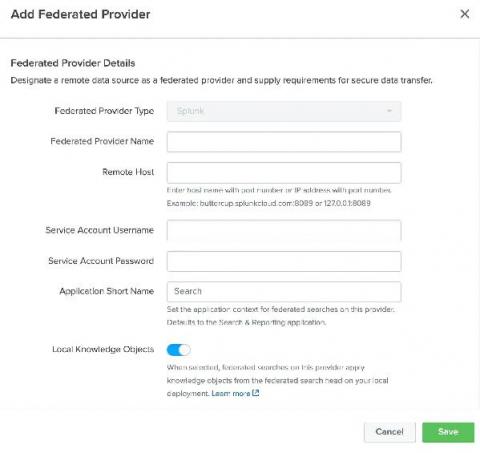
Introducing Splunk Federated Search
Rapid digital transformation partnered with increased cloud adoption have resulted in organizations generating unprecedentedly large volumes of data. This data is stored in disparate data repositories due to organizational boundaries, data protection, and privacy laws (e.g. GDPR). Additionally, it is stored across environment types with some kept in the cloud and often historical data and other sensitive data types are kept in on-premise environments contributing to more data silos.
Managing Updates to the Splunk Cloud Vetting Process
Before apps can be installed in a customer’s Splunk Cloud deployments, these apps have to go through Splunk’s cloud vetting process. Cloud vetting helps ensure that apps are safe and performant for our mutual customers to use in Splunk Cloud. It’s important for us to make regular updates to our cloud vetting requirements in order to ensure apps running on Splunk Cloud are “up to snuff”.
Demystifying the Hype Around XDR
Extended Detection and Response (XDR) has generated a lot of buzz recently with press, analysts, and even customers. There’s no denying that, at face value, its promise of reduced complexity and cost while increasing detection and response is alluring. As security teams look to modernize their security tooling, they’re also looking for solutions to some of their largest challenges. Is XDR the answer? What is XDR, exactly, and how do you determine if it’s right for your organization?
Real User Monitoring: Past, Present and Future
Most front-end developers and practitioners are familiar with real user monitoring (RUM) tools as a means to understand how end-users are perceiving the performance of applications. Few people, however, are aware of the history of the RUM market, going back more than two decades. Over the years, as the internet has evolved with new technologies, RUM tools have evolved in lock-step to cater to the ever changing needs and use cases of engineering teams.
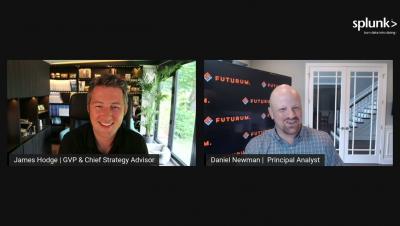
That's A Data Problem - Accelerating Cloud Transformation | Splunk's James Hodge & Daniel Newman
Monitoring IT Just Got Easier: Introducing the New Splunk App for Content Packs
We’re thrilled to announce the release of the Splunk App for Content Packs, an app that acts as a one-stop shop for prepackaged content and out-of-the-box searches and dashboards for common IT infrastructure monitoring sources, making it easy to get up and running with Splunk for IT use cases. In the past, you may have had to install and manage individual apps like Splunk App for VMWare and Splunk App for Windows Infrastructure.
The Digital Experience Trap: Are Companies Going Pro With Amateur Tools?
Recently, I’ve been thinking a lot about the relationship between world-class athletes and world-class IT systems. At first glance, it seems like there’d be little to compare, but there’s an interesting relationship between preparation and performance both these worlds share. During the Olympics, we see people cover 100 metres in under 10 seconds, cut through a pool in a minute, and stick landings with precision.
Five Questions Your Organization Must Ask to Prepare For a Ransomware Attack
Since last week, I’ve been speaking with Splunk customers and our own team about the cyberattacks impacting the Kaseya software platform. While Splunk was not impacted by the ransomware attack, as a security leader we want to help the industry by providing tools, guidance and support. It’s critical that we work together as a community to counter cybersecurity threats and share information about events like these.
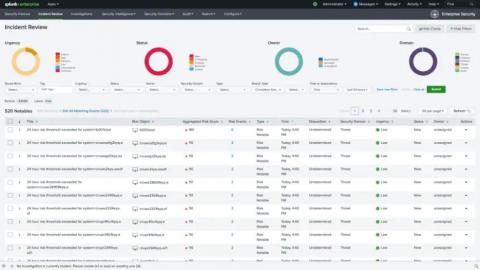
What's New with Splunk Enterprise Security 6.6?
We are super excited to announce updates to Splunk Enterprise Security (ES) with our latest 6.6 release. Get ready for the latest and greatest that Splunk Enterprise Security has to offer. Let's dive right into it.
Splunk Named a Leader in the 2021 Gartner SIEM Magic Quadrant for the Eighth Time
Splunk was named a Leader for the eighth consecutive time this week in the Gartner Magic Quadrant for Security Information and Event Management (SIEM)*. In our opinion, this recognition marks one of the longest running recognitions in the history of the SIEM market. The recognition comes on the heels of Splunk also being ranked No.
Kaseya, Sera. What REvil Shall Encrypt, Shall Encrypt
When Splunk told me we would have a “breach holiday” theme for the summer, I didn’t think it would be quite so on the nose… For those of you who have been working on this Kaseya REvil Ransomware incident over the weekend, I salute you. We’ve been doing the same. As usual, my team here at Splunk likes to make sure that we have some actionable material before posting a blog, and this time is no different.
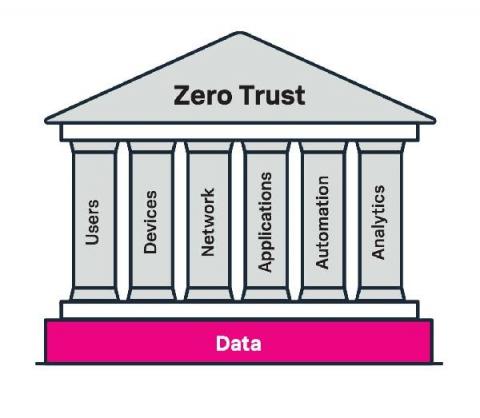
Fashionably Late: The Zero Trust Trend is Here to Stay
I have often joked that IT, and in particular cybersecurity, is like fashion — not a lot is ever new, just reimagined and, in some cases, improved. As I sit pondering the beauty of my COVID-19 comb-over mullet, I have found myself thinking about how this fashion analogy applies to zero trust.
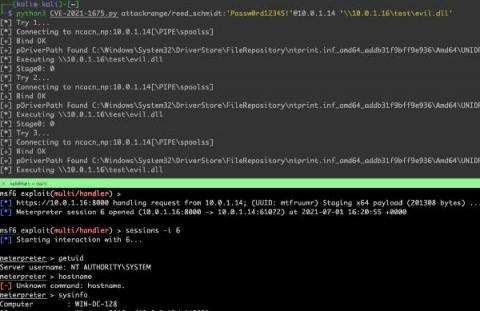
I Pity the Spool: Detecting PrintNightmare CVE-2021-34527
On Monday, June 21st, Microsoft updated a previously reported vulnerability (CVE-2021-1675) to increase its severity from Low to Critical and its impact to Remote Code Execution. On Tuesday, June 29th, a security researcher posted a working proof-of-concept named PrintNightmare that affects virtually all versions of Windows systems. Yesterday, July 1, Microsoft assigned this flaw a new CVE, CVE-2021-34527.
How to Optimize Your Cloud Spend Using Observability
The rise of public cloud services has enabled businesses to innovate faster, scale effortlessly, and adopt more advanced technologies easier than ever before. However, there’s a dark side to using public cloud services: complexity and cost. Public cloud services can scale to handle almost any workload, but in doing so, they can quickly generate unpredictable costs for your business.
Distributed Tracing for Kafka Clients with OpenTelemetry and Splunk APM
This blog series is focused on observability into Kafka based applications. In the previous blogs, we discussed the key performance metrics to monitor different Kafka components in "Monitoring Kafka Performance with Splunk" and how to collect performance metrics using OpenTelemetry in "Collecting Kafka Performance Metrics with OpenTelemetry." In this blog, we'll cover how to enable distributed tracing for Kafka clients with OpenTelemetry and Splunk APM.


