Operations | Monitoring | ITSM | DevOps | Cloud

Latest Posts

The Leading SNMP Monitoring Tools

SNMP, which stands for Simple Network Management Protocol, is often viewed as a legacy protocol, with SNMP not being actively worked on anymore, which led to both Microsoft and Google pronouncing that SNMP was dead. Yet, SNMP is still commonly used by numerous industries as the advantages of SNMP, especially for network monitoring, are profound. Practically, all network components across all vendors possess built-in SNMP capability.

"With great power..." what Spiderman can teach us about sustainable growth for the data centre sector

The Foundations of the Future report recently commissioned by techUK, and developed by Henham Strategy, raises many points for consideration. It is an important attempt at quantifying the UK’s data centre assets. As a sector, the UK data centre industry is worth £4.7 billion in Gross Value Added (GVA) annually, supporting 43,500 jobs and contributing £640 million in tax revenue to the exchequer.

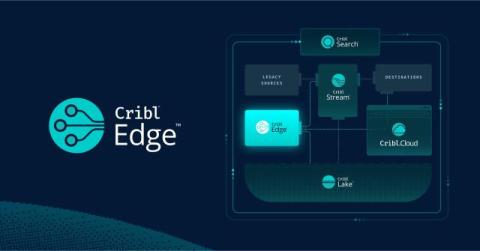
Simplify OpenTelemetry Metrics with Cribl Edge OTLP Conversion

Cribl Edge can send data to OpenTelemetry in several different ways. In this blog post, we’ll focus on the OpenTelemetry Metrics. In the blog, we’ll talk about Cribl Edge, but what we say applies to Cribl Stream, too! We will cover how to use Cribl Edge to collect Linux System Metrics, transform them into the OTLP Metrics format, and deliver them to an OTLP Destination.

Reflecting on Site24x7's digital experience monitoring for the year 2024!

Last year, we made significant progress at Site24x7. We focused on delivering new features and updates to improve your monitoring experience. Our releases and enhancements this year were more focused towards including more metrics, widening your visibility into the performance of your resources, and ensuring that you're not missing out on even the minutest data. We hope you've found these improvements valuable.

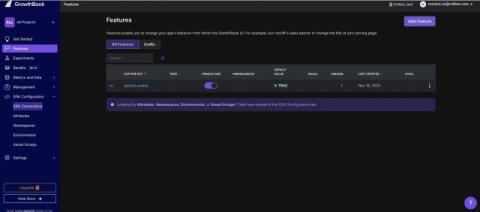
Smarter Operations: How Rollbar + GrowthBook Minimize Downtime and Boost Reliability

Software development and operations teams are the guardians of system stability, ensuring uptime, reliability, and performance across complex software ecosystems. The stakes are high—every second of downtime impacts your brand’s reputation and bottom line. That’s why integrating Rollbar’s error monitoring with GrowthBook’s feature flagging is a game-changer for ops teams.

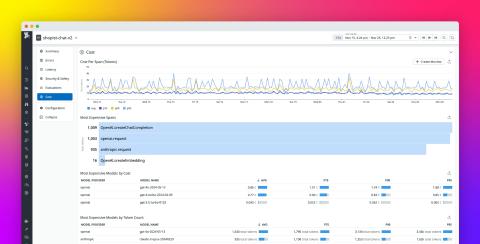
Monitor your OpenAI LLM spend with cost insights from Datadog

Managing LLM provider costs has become a chief concern for organizations building and deploying custom applications that consume services like OpenAI. These applications often rely on multiple backend LLM calls to handle a single initial prompt, leading to rapid token consumption—and consequently, rising costs. But shortening prompts or chunking documents to reduce token consumption can be difficult and introduce performance trade-offs, including an increased risk of hallucinations.

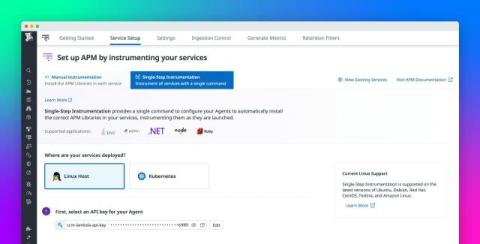
Achieve total app visibility in minutes with Single Step Instrumentation

Datadog APM and distributed tracing provide teams with an end-to-end view of requests across services, uncovering dependencies and performance bottlenecks to enable real-time troubleshooting and optimization. However, traditional manual instrumentation, while customizable, is often time consuming, error prone, and resource intensive, requiring developers to configure each service individually and closely collaborate with SRE teams.

How Datadog migrated its Kubernetes fleet on AWS to Arm at scale

Over the past few years, Arm has surged to the forefront of computing. For decades, Arm processors were mainly associated with a handful of specific use cases, such as smartphones, IoT devices, and the Raspberry Pi. But the introduction of AWS Graviton2 in 2019 and the adoption of Arm-based hardware platforms by Apple and others helped bring about a dramatic shift, and Arm is now the most widely used processor architecture in the world.

Unlocking Insights with Heroku Logs: Complete Guide

Heroku is a popular platform for deploying and scaling applications, and one of its standout features is its centralized logging system. Heroku logs give you visibility into your application’s behaviour, infrastructure events, and platform activities. When paired with a robust monitoring solution like Atatus, you can transform raw log data into actionable insights that keep your applications running smoothly.