Operations | Monitoring | ITSM | DevOps | Cloud
RUM
Raygun Real User Monitoring - 2 Minute Walkthrough
What Is Real User Monitoring? How It Works, Examples, Best Practices, and More
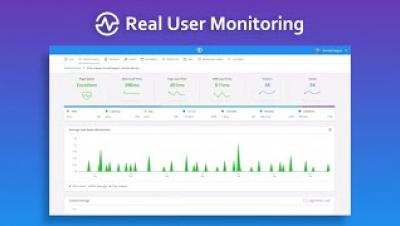
Real User Monitoring is a type of performance monitoring that captures and analyzes each transaction by users of a website or application. It’s also known as real user measurement, real user metrics, end-user experience monitoring, or simply RUM. It’s used to gauge user experience, including key metrics like load time and transaction paths, and it’s an important component of application performance management (APM).
Real-User Monitoring for Single-Page Apps
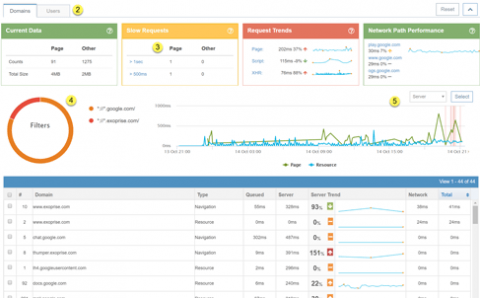
Exoprise Service Watch, our real-user monitoring (RUM) product, recently improved support for monitoring Single-Page Apps (SPAs) which have become the foundation for many Software-as-a-Service applications like GSuite, Salesforce Lightening, or Microsoft’s Outlook Web Access. SPAs have unique requirements when it comes to capturing and monitoring end-user experience especially through different network configurations, proxies, firewalls and branch office users.
Real User Monitoring vs Synthetic Monitoring: Why You Need Both
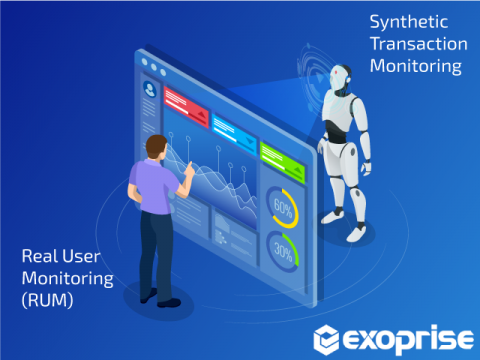
When it comes to Application Performance Management (APM), there are two main technologies used to measure end-user perspective performance: synthetic monitoring (STM) and real user monitoring (RUM). We’ll discuss the pros and cons of each of the technologies especially related to monitoring third-party apps. Third-party apps like Office 365 and GSuite are experiencing a surge of growth for mission-critical purposes within business.
SPA Tracking & Monitoring: How to Build Better Single-Page Applications Through RUM (Real User Monitoring)
Did you know roughly half of the users that visit your website leave if it takes more than 3 seconds to load? Optimizing your website or webapp for stellar performance is always a crucial goal for any software based business. But, the ecosystem has changed in recent years. Smartphones are taking over. Developers need to build websites and optimize for performance primarily targeting these smaller devices. It’s not solely about performance though.
Integrate Akamai mPulse real user monitoring with Datadog
Akamai mPulse is a real user monitoring (RUM) service that enables organizations to get deep visibility into end user experience across their websites or applications. With mPulse, businesses can collect high-granularity metrics directly from their users’ browsers, and then analyze that data to pinpoint slow resources (e.g., third-party scripts), track user engagement, and make decisions to improve the performance of their products.
The 7 best Real User Monitoring tools for 2019
Dash 2019: Guide to Datadog's newest announcements
At Dash 2019, we are excited to share a number of new products and features on the Datadog platform. With the addition of Network Performance Monitoring, Real User Monitoring, support for collecting browser logs, and single-pane-of-glass visibility for serverless environments, Datadog now provides even broader coverage of the modern application stack, from frontend to backend.
Synthetic Monitoring vs. Real User Monitoring for Application Performance Management: Pros and Cons
It is no longer sufficient for IT operations teams to monitor resources like CPU, memory and disk utilization. The success of any IT initiative these days is measured based on user experience. Irrespective of the type of application in question – whether email, Citrix/VDI, SAP, web application – application availability and response time are key measures of user experience. Application outages not only affect users, they can also impact the business.


