Operations | Monitoring | ITSM | DevOps | Cloud

Product Release

KUDO for Kubeflow: The Enterprise Machine Learning Platform

Machine learning is the power cable for your business. Without it, your data center is a museum of hard drives. While machine learning can supercharge data-driven businesses, it requires both expertise and a complex suite of technologies to make it work. D2iQ’s KUDO for Kubeflow, which is in technical preview, is the enterprise platform designed to take you from prototype to production in no time.

MicroK8s HA tech preview is now available

High availability (HA) for MicroK8s, the lightweight Kubernetes, is now available as a tech preview for Linux, Windows and macOS. The Kubernetes control plane can now be distributed across multiple nodes, bringing resiliency to the cluster while maintaining a low footprint using Dqlite, the distributed SQL engine as the Kubernetes datastore.

OpManager now supports SMSEagle, Twilio, and Clickatell, so you can get SMS alerts anywhere!

IT admins need to know the status of their IT devices, servers, routers, switches, and firewalls. To meet this need, OpManager has a highly responsive and robust notification and alerting system that sends alerts via email, Slack, and even SMS. Murphy’s law says anything that can go wrong will go wrong, and if you’re in IT, you’re probably familiar with how easily things can go wrong.

Test on-premise applications with Datadog Synthetic private locations

Synthetic monitoring lets you improve end user experience by proactively verifying that they can complete important transactions and access key endpoints. But your applications serve many users, from customers to all the employees who run your business. This makes testing the performance of any internal-facing services within your private network just as critical as monitoring your external-facing applications.

New free Ping Tool. Ping from multiple locations all at once.

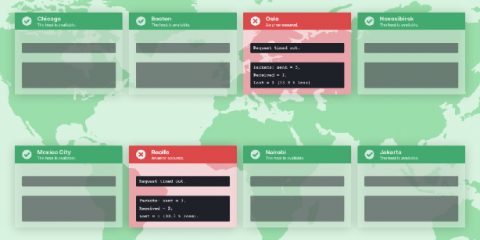
Ping is a network tool. The tool seeks out a given address over a network to check if one networked device can communicate with another device. The tool then reports on the quality of the connection based on data loss and response times. Uptrends’ new Ping Tool conducts ping tests from multiple worldwide locations at the same time. You can instantly spot localized downtime and latency issues from around the world using one simple tool.

New Enterprise features in Grafana 7.0: Usage insights and user presence indicator

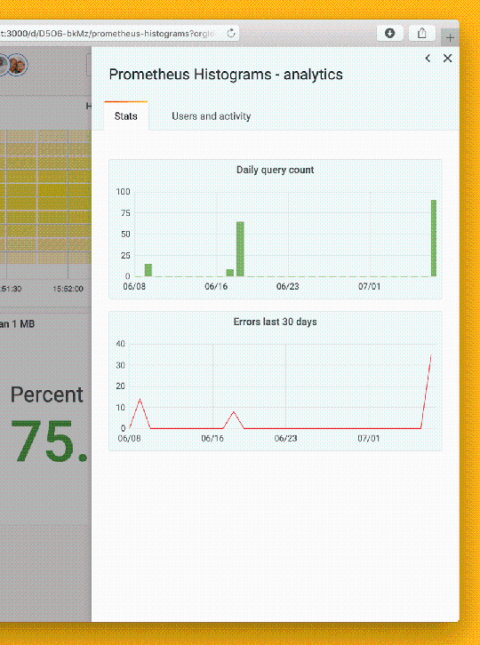
Dashboard sprawl is a real problem whether you’re using Grafana or any other tool. When growing to thousands of users – and as many dashboards – you’ll eventually want more information about how the tool is being used in your organization. After all, dashboards don’t help anyone if they aren’t being used. Managing large installations is one of the areas where Grafana Enterprise improves Grafana, and our launch of usage insights in 7.0 is a key part of that.

GitKraken Git GUI v7.1: Trello Integration

The GitKraken Git GUI now integrates with Trello as an issue tracker! You can now manage your Trello issues directly from the GitKraken ecosystem. This allows developers to stay focused on the lines of code in front of them, while also staying on top of personal and team assignments. You no longer have to leave the GitKraken Git GUI to do the following: *Paid features. The Trello integration isn’t the only treat you will enjoy courtesy of the GitKraken Git GUI v7.1 release.