Operations | Monitoring | ITSM | DevOps | Cloud

%term

Troubleshooting Kafka Clusters: Common Problems and Solutions

Apache Kafka’s thing is real-time data streaming. But keeping it running at full throttle? That takes more than just spinning up a cluster and hoping for the best. As your environment grows, you’ll need to do some tweaking to make sure Kafka keeps up with the pace. The good news? You don’t need to be a Kafka wizard to make a real difference. Even some basic tuning can have a big impact on performance.

What is DORA and how will it affect me?

The Digital Finance Strategy is a European directive that aims to support and develop digital finance in Europe while maintaining financial stability and consumer protection. There are three main components to the package: In this blog post, we’ll attempt to summarize the 113-page DORA proposal, highlighting how it will apply to incident management at financial entities. Side note: we also wrote a blog post about the other DORA, also known as the DevOps Research and Assessments.

Unlock the Real Value of Logs With Honeycomb Telemetry Pipeline and Honeycomb for Log Analytics

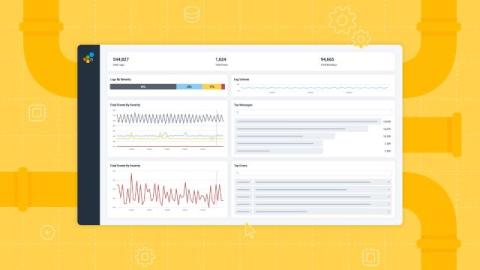
At Honeycomb, we know how important it is for organizations to have a unified observability platform. This is why we’re launching Honeycomb Telemetry Pipeline and Honeycomb for Log Analytics: to enable engineering teams to send and analyze data—including logs—into a single, unified platform. For too long, teams have had to wrangle large volumes of logs, their context scattered across multiple teams and tools, leading to knowledge silos.

How NaaS and APIs are reshaping enterprise connectivity

As enterprises continue to migrate workloads to cloud environments, they are reaping significant benefits, such as scalability, agility, and the ability to deploy applications in near real-time. However, these advantages are often undermined by the limitations of legacy networks. Traditional networks, restricted by long-term contracts and inflexible delivery timelines, are no longer fit for purpose in a cloud-driven world.

Introducing UptimeRobot's Core Monitoring Infrastructure Upgrade: What's Changing And What it Means For You

At UptimeRobot, we’re always evolving to serve you better—while understanding that change can sometimes be inconvenient. We’re excited to announce a major infrastructure upgrade designed to boost performance, scalability, and reliability. This upgrade will help us deliver faster, more reliable service as we grow, and we hope you’ll see the benefits soon.

Cisco uses Elastic to save 5,000 support engineer hours a month

With the precision of search and the intelligence of AI, Cisco uses Elastic on Google Cloud to create richer search experiences, so support engineers can quickly find the answers they need. Scaling from this success, Cisco's Search team added AI models, semantic search, and vector search to more than 50 internal- and external-facing apps, helping them innovate more quickly and increase overall operational efficiency.

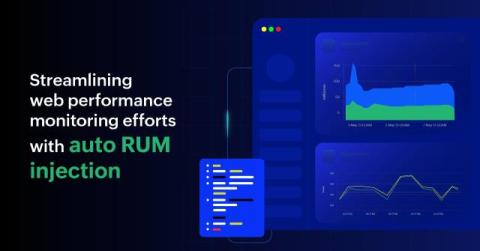
How can you simplify web performance monitoring with auto RUM injection

Real user monitoring (RUM) is a powerful tool for optimizing the end-user experiences of web applications. With insights into performance, load times, user behavior, and more, RUM enables businesses to identify and address issues that negatively impact user satisfaction. Consider a scenario where a growing e-commerce company experiences periodic slowdowns during peak hours, adversely affecting user experiences and sales.

Best Practices for Testing Zone Redundancy

The way the story goes is that in the old days Amazon used to cut power to data centers so they could see if their services were actually redundant across different data centers; and that they only abandoned this practice when EC2 customers started to complain (no matter how many times they were warned their instances might disappear without notice). This story may be apocryphal, but you don’t need to be worried about power loss outages in order to have a given data center go down.