Operations | Monitoring | ITSM | DevOps | Cloud

Blog

Logging vs Monitoring: How are They Different & Why You Need Both

Logging or monitoring? If you deploy and manage an application, these are the two key techniques available to you for helping to ensure that the application meets availability and performance expectations. One of them is Application Performance Management, or APM, though you can also find it referred to as ‘Application Performance Monitoring’ or simply ‘monitoring’. The other is log analytics and management or just ‘logging’.

The 7 Stages of the Client-Side Hacking Lifecycle

The threat of your customers being attacked directly on the client-side is more real today than ever before. Magecart are knocking on everybody’s door – you, your 3rd parties, and even their 4th parties. This is happening continuously, with Magecart looking for opportunities to steal your valuable data for sale on the dark web. It’s a complex and ever-changing problem. So what stage are you at in the customer hacking lifecycle?

ICYMI: Grafana Labs at PromCon

PromCon was held in Munich again this year, and this year was the best. I had a great time meeting lots of old friends and interacting with the amazing Prometheus community. I want to give a big shout out to Richi H for organizing the conference, and to everyone who attended for being an amazing audience! This year Grafana Labs carbon offset travel and food for the conference – but this post is not about that. Grafanistas gave 4 talks in the main track and another 6 lightning talks.

Logging Kubernetes on AKS with the ELK Stack and Logz.io

Hosted Kubernetes services such as AKS were introduced to help engineers deal with the complexity involved in deploying and managing Kubernetes clusters. They do not cover, however, the task of monitoring Kubernetes and the services running on it. While some of the hosted Kubernetes services offer logging solutions, they do not offer all the functionality, flexibility and user-experience expected from a modern log management solution.

Deprecating Our Legacy JavaScript SDK

Sentry is full of engineers, so we know how painful it can be to deal with breaking changes caused by third party libraries. But we also know those third party libraries have to continually update and stay on top of their games, or they’ll become irrelevant. For that reason, we try to only introduce breaking changes when they’re really (really) required. Especially when those changes are made to an API surface.

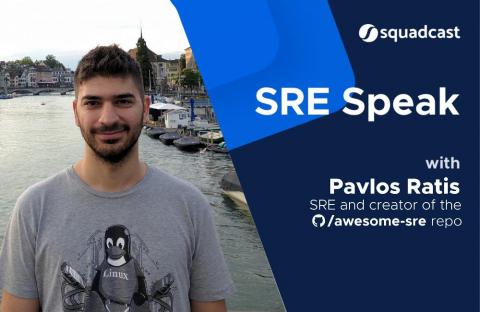
Pavlos Ratis shares his experience on being an SRE

Pavlos is a Site Reliability Engineer based in Munich, Germany. He likes building software and expanding his knowledge around the reliability of services and their infrastructure. He has created a few open-source SRE projects such as the awesome-sre, Wheel of Misfortune, Availability Calculator, and awesome-chaos-engineering to assist teams and individuals in getting on board with the SRE culture.

Migrating from IOpipe to Lumigo

You’ve no doubt heard that IOpipe has been acquired by New Relic (congratulations to both). As part of the acquisition, New Relic has said it intends to retire the IOpipe platform in the next 30 days. If you’re currently relying on the IOpipe platform to monitor and debug your serverless application you have an important decision to make. One option is to try out New Relic’s serverless monitoring functionality.

Postmortems vs. Retrospectives: When (and How) to Use Each Effectively

When we announced the launch of our Retrospectives Guide, we wrote about the value of scaling the continuous improvement mindset to beyond Product Development at PagerDuty by establishing the RetroDuty community. In this installment of our blog post series on retrospectives, I highlight the differences between postmortems and retrospectives. You might have heard of postmortems and/or retrospectives before reading our guides.

Network baseline: new technologies, new challenges

The issue of network baseline arose quite some time ago. Everything started from the understanding that networks are not static entities, but are a set of elements that change over time. It was also understood that networks are not only made up of physical and tangible elements, such as a router or a switch, but we must also have more abstract elements, such as the traffic pattern over a WAN link, for example.

How to Monitor AWS CloudTrail Logs with Sumo Logic

This is the third and last in a series of articles on Amazon CloudTrail. In the first part of the series, we introduced AWS CloudTrail and how it works and saw where and how it saves its data. We then learned how to query CloudTrail logs in the second part of the series where we used Amazon Athena to find meaningful information from large volumes of CloudTrail data.