Operations | Monitoring | ITSM | DevOps | Cloud

%term

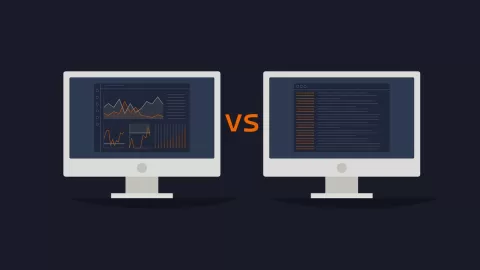
Logging vs. Metrics

When discussing observability, the “big 3” - logs, metrics, and traces, come to mind. But for some, the less they have to implement, the better. Our lead engineer, JJ, had some advice to share about how logs may not be necessary for everyone. Simplifying your stack isn’t difficult - you just need to be intentional with implementation. Check out more MetricFire blog posts below, and our hosted Graphite service! Get a free trial and start using MetricFire now!

Redgate's new PostgreSQL book is now available for free download

Redgate's new book, 'Introduction to PostgreSQL for the data professional', is now available for free download. Hear from authors Ryan Booz & Grant Fritchey about their inspiration for the book and the challenges they faced along the way. While the documentation around PostgreSQL is detailed and technically rich, finding a simple, clear path to learning what it is, what it does, and how to use it can be challenging.

Guide: Assessing the ROI of an Internal Developer Portal (IDP)

When considering or advocating for an Internal Developer Portal (IDP) within your organization, assessing potential impact is an exciting, but sometimes challenging endeavor, especially considering the broad set of use cases IDPs support and the lack of context and visibility before the presence of an IDP. Maybe you understand the inherent value of an IDP, but need to quantify the estimated savings/impact to justify the spend.

Introducing Learning journeys: New step-by-step guides to get started with Grafana

Our Big Tent philosophy provides the foundation for our broad, modular, and flexible observability platform. With Grafana’s powerful ability to integrate with a wide range of data sources, tools, and plugins, you can create customized solutions tailored to your unique needs.

Linux Coredumps (Part 1) Introduction

One of the core features of the Memfault Linux SDK is the ability to capture and analyze crashes. Since the inception of the SDK, we’ve been slowly expanding our crash capture and analysis capabilities. Starting from the standard ELF coredump, we’ve added support for capturing only the stack memory and even capturing just the stack trace with no registers and locals present.

GitKraken Desktop: Visualize Git, Simplify Version Control

Explore the future of version control with GitKraken Desktop on Windows, Linux, and Mac! Embrace a clear, user-friendly interface that simplifies Git and enhances developer collaboration. With intuitive features like the Commit Graph and Focus View, tracking changes and managing pull requests has never been easier.

SolarWinds 2025.1: New Network Device Support You Need to See!

Discover what’s new in SolarWinds Platform 2025.1! This update brings expanded network device support for Aruba, Fortinet, Ruckus Smart Zone Wireless, and Extreme Networks. Get hardware health insights, Layer 2 & 3 metrics, VLAN details, routing table utilization, and more!

SRE Challenges & APM Solutions

Site Reliability Engineers (SREs) face constant challenges as cloud environments and microservices grow more complex. Performance issues often go unnoticed until they escalate, leading to downtime and disruptions. With Site24x7 APM, you can stay ahead of issues before they impact your business. Our Application Performance Monitoring (APM) solution provides real-time insights, predictive analytics, and deep visibility across your entire IT ecosystem—helping you.

PagerDuty for Financial Services

PagerDuty acts as the primary interface for real-time actions, seamlessly connecting humans and systems. From the moment a monitoring tool detects a signal to the resolution of an incident, every action is automatically tracked and timestamped. With reduced human error and no risk of missed documentation, PagerDuty provides a reliable, efficient, and transparent incident management solution for financial entities.