Operations | Monitoring | ITSM | DevOps | Cloud

Alerting

Model-driven observability: Embedded Alert Rules

This post is about alert rules. Operators should ensure a baseline of observability for the software they operate. In this blog post, we cover Prometheus alert rules, how they work and their gotchas, and discuss how Prometheus alert rules can be embedded in Juju charms and how Juju topology enables the scoping of embedded alert rules to avoid inaccuracies.

New integrations: Amazon EventBridge, ServiceNow, Zendesk, Zammad, Splunk, and More

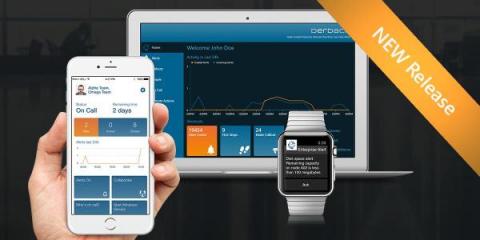
Our ecosystem continues to grow: we have added 10 new integrations within the last months. Integrations are the bridge between alert sources and on-call teams and have always been a top priority at iLert. They are one of the reasons why iLert is so easy to adopt for small and large companies alike.

Midwifery Care Communities Trust OnPage

The OnPage clinical communication and collaboration (CC&C) system is universally adopted by midwifery care communities across the United States and Canada. OnPage is proud to provide a real-time, secure collaboration platform that allows midwives to improve patient experience. This article examines the continued widespread adoption and implementation of OnPage’s industry-leading CC&C system by midwifery care communities.

Logz.io Extends Alert Communications via Microsoft Teams Integration

If you’re a DevOps practitioner working in a Microsoft-centric environment, you’ll be pleased to learn that Logz.io recently added support for the popular Teams communications hub to help broadcast pressing alerts and other monitoring data. The integration comes on the heels of making the Logz.io platform directly available from within the Azure Console and expands organizations’ abilities to communicate and share notifications about everything from log data to security events.

Automatic Alert Export to Third-Party Systems

In the SIGNL4 web portal you can manually export historic alert reports as.csv files. In some cases it might be useful to export alert data programmatically. For example you can forward all alerts including specific parameters to InfluxDB and show the alert history in Grafana to recognize peaks, trends and abnormalities over time. You can even use AIOps to recognize certain trends automatically. By using the SIGNL4 REST API it is possible to export alert data automatically.

How to Clear Up Alert Storms by 90%?

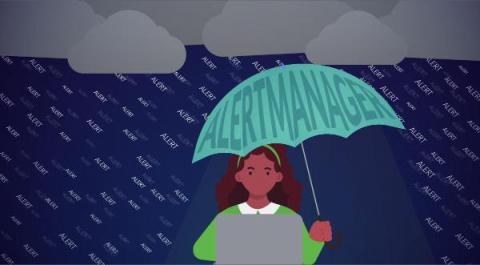
Alerts are notifications from AIOps monitoring tools that indicate that there is an anomaly. IT teams get these alerts on their monitoring dashboard via emails or enterprise collaboration tools such as Slack or Teams. Service level agreements expect IT teams to analyze every alert within a specific timeframe and take appropriate action.

How to Control Alert Fatigue?

Alerts are indispensable to any IT operations system today. Site reliability engineers (SREs) or ITOps executives set up several monitoring tools for their IT landscape. When there is a change, high-risk action, or outage in any of these incidents, the monitoring tool triggers an automated alert. This could happen on the monitoring tool’s dashboard itself, via email, or enterprise collaboration tools like Slack or Teams.