Operations | Monitoring | ITSM | DevOps | Cloud
Analytics
Deep Learning Toolkit 3.6 - Automated Machine Learning, Random Cut Forests, Time Series Decomposition, and Sentiment Analysis
We’re excited to share that the Deep Learning Toolkit App for Splunk (DLTK) is now available in version 3.6 for Splunk Enterprise and Splunk Cloud. The latest release includes: Let’s get started with the new operational overview dashboard which was built using Splunk’s brand new dashboard studio functionality which I highly recommend checking out. You can learn more about it in this recent tech talk which you can watch on demand.
Preparing for the Elastic Certified Engineer Exam - Get Elasticsearch Certified
How versatile is the Elastic Stack? Ask Walmart, NASA, or Airbus.
What do an airline, the world’s largest retailer, the French government, Adobe, and NASA’s JPL have in common? They use the Elastic Stack to empower customers, communities, and, even, interplanetary exploration. With the Elastic Stack’s ability to take data from any source and in any format, and then search, analyze, and visualize it in real time, organizations can act quickly to improve customer experience and power critical systems.
Introducing InfluxData Support
When learning a new technology stack or language, access to good documentation, tutorials, and support is critical to lower the barrier to adoption and enable users to take advantage of the tools themselves. At InfluxData, we support our users by providing the following resources. Searching through all of these resources and more, like GitHub issues, can be time-consuming and difficult. In response, the support team at InfluxData has recently created InfluxData Support.
How to visualize your business performance with cohort tables using Grafana and BigQuery
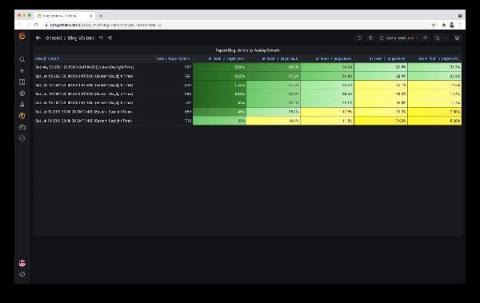
Grafana presents some of the most versatile tools for visualizing and understanding the real-time performance and reliability of systems, regardless of where your data lives. But one question our customers frequently ask is, “Can I use Grafana to understand the health and performance of my business?” More often than not, our answer is yes.
Introducing Splunk Federated Search
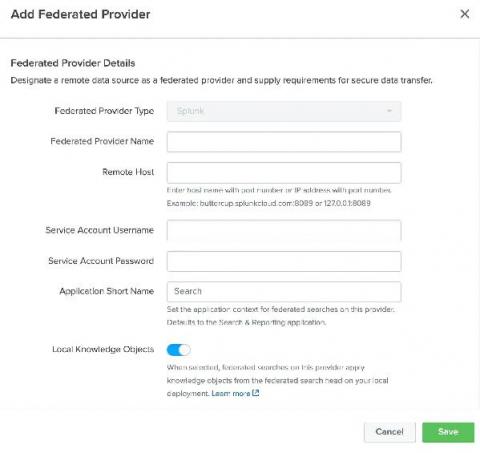
Rapid digital transformation partnered with increased cloud adoption have resulted in organizations generating unprecedentedly large volumes of data. This data is stored in disparate data repositories due to organizational boundaries, data protection, and privacy laws (e.g. GDPR). Additionally, it is stored across environment types with some kept in the cloud and often historical data and other sensitive data types are kept in on-premise environments contributing to more data silos.
Using the New Flux Usage API to Calculate Pricing for InfluxDB Cloud
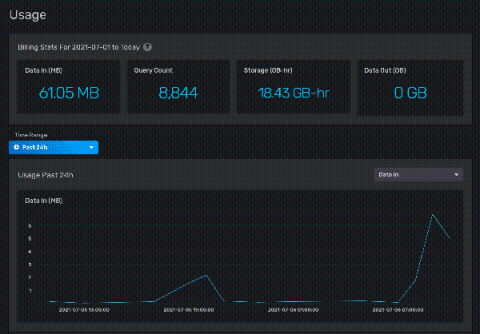
InfluxDB Cloud offers a transparent usage-based pricing model that only charges users on the work performed, with no minimums or long-term commitments. This puts YOU in charge of what you spend. However, with four separate pricing vectors, it’s not always easy to see exactly where that cost is going, or how to estimate your potential spend based on your data usage.
How does search solve data problems?
Is enterprise data a benefit or a burden? Think about all of the data your organization generates and consumes in the digital age — from security event logs to application error messages, energy consumption to vendor contracts. There is so much, and all of it is usually stored in silos, making the data difficult to synthesize to provide better services, identify signals proactively, or make stronger business decisions.


