Operations | Monitoring | ITSM | DevOps | Cloud

The latest News and Information on Application Performance Monitoring and related technologies.

Raygun API Beta is now open to everyone

We’re excited to announce the offical Beta launch of the Raygun API, allowing you to extract, manipulate, and visualize insights from your account in innovative ways. This is included with all Raygun plans, and is now readily available to customers of all sizes. We’ve made the decision to release this Beta sooner than anticipated, as we’re eager to receive your early feedback to make sure we’re focussing on the endpoints that provide the most value to your team and business.

Integrate eG Enterprise with Multiple ITSM Tools at the Same Time

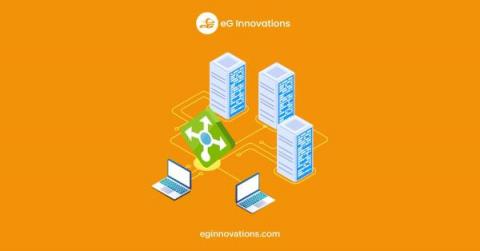
Previous versions of eG Enterprise limited the eG Manager integration to a single ITSM system such as ServiceNow ITSM, Autotask, JIRA or others. This limitation was particularly cumbersome for SaaS and MSP (Managed Service Provider) deployments where each tenant/customer may have had their own preferred ITSM system. Our latest release lifts this restriction. ITSM integration can now be done for a specific Organization, Organizational Unit, or even User.

What is Retrace Application Performance Monitoring (APM)?

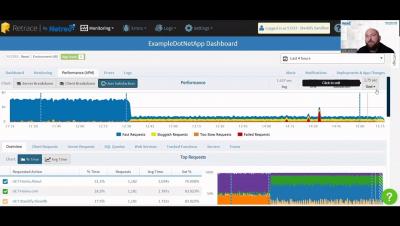
Retrace is so much more than your average Application Performance Monitoring tool; and the more you know about the tools and capabilities at your disposal, the easier it is to keep application performance humming. In this Retrace overview video, Stackify by Netreo Customer Success Lead Kyle Jackson shares valuable insights into how and why Retrace works the way it does, and the powerful monitoring capabilities that help you improve the performance of your applications.

AI & Application Performance Monitoring Opportunities & Challenges

In today’s fast-paced world, app performance equals brand reputation. Customers expect apps that are fast, responsive and available 24/7. That’s where Application Performance Monitoring (APM) comes in. The technology enables businesses to ensure the best possible user experience by monitoring and managing the performance of their applications. But as applications become increasingly complex, identifying and resolving performance issues in real-time becomes increasingly difficult.

eG Enterprise rated the No. 1 APM Tool for Customer Experience by SoftwareReviews

The reviews are in! We are thrilled that eG Enterprise has been recognized by SoftwareReviews, a division of Info-Tech Research Group, as a Champion in the 2023 Application Performance Management – Enterprise (APM) Tools Emotional Footprint Buyer’s Guide. Moreover, eG Enterprise APM was ranked in the top spot out of 14 vendor solutions.

Observability vs Monitoring - The difference explained with an example

Observability vs monitoring has been a common topic in DevOps recently. There has been a lot of debate, and I have learned a lot from them when I started my observability journey. Most literature on observability is associated with a particular product or shares a textbook definition. In this blog post, I want to give you a practical understanding of observability and the differences between observability and monitoring with different scenarios and examples. We will cover the following topics here.

Trace-based testing with Elastic APM and Tracetest

This post was originally published on the Tracetest blog. Want to run trace-based tests with Elastic APM? Today is your lucky day. We're happy to announce that Tracetest now integrates with Elastic Observability APM. Check out this hands-on example of how Tracetest works with Elastic Observability APM and OpenTelemetry! Tracetest is a CNCF project aiming to provide a solution for deep integration and system testing by leveraging the rich data in distributed system traces.

Loki vs Prometheus - Differences, Use Cases, and Alternatives

Loki and Prometheus are both open source tools. While Loki is a log aggregation tool, Prometheus is a metrics monitoring tool. Loki’s design is inspired by Prometheus but for logs. This blog post compares the two common monitoring tools Loki vs Prometheus, to help you understand their key differences. Log management and metrics monitoring are critical aspects of monitoring a software system effectively.

4 Azure Load Balancer Metrics to Monitor

An Azure Load Balancer is a Layer-4 (TCP, UDP) load balancer that provides high availability by distributing incoming traffic among healthy VMs. A load balancer health probe monitors a given port on each VM and only distributes traffic to an operational VM. Azure Load Balancers are frequently used in Azure Virtual Desktop (AVD) deployments. From our work with Azure Load Balancer, we think there are 4 key metrics and events you should proactively monitor and alert on.