Operations | Monitoring | ITSM | DevOps | Cloud

APM

The latest News and Information on Application Performance Monitoring and related technologies.

Static vs Dynamic Alert Thresholds for Monitoring

Every modern monitoring product will have some capabilities to leverage thresholds of some sort to automatically raise alerts when critical metrics pass a value that indicates something of concern may be occurring, such as a performance slowdown, resource constraint, or availability issue.

Sponsored Post

The top 12 APM tools for 2022

Application performance monitoring (APM) tools give you insight into the server-side performance of your website or application. From increased uptime and improved user experiences to reduced risks and decreased expenses, it provides an array of business benefits that help you move faster than competitors and deliver more value to users. So it comes as no surprise that, according to analysis by Emergen Research, the global market for application performance monitoring (APM) tools is expected to reach $15B in 2028, an impressive uptick from 2020's $6.54B.

Datadog on Informed Product Development

Datadog is an observability and security platform. That means that our users may be in a high stress situation: debugging an issue in production, managing an incident or responding to a security threat. Having a good UX is particularly critical in those cases. User interviews are very helpful, but after a product has been released in production we are able to gather a lot more data to understand how customers interact with it and make decisions about how it can be improved.

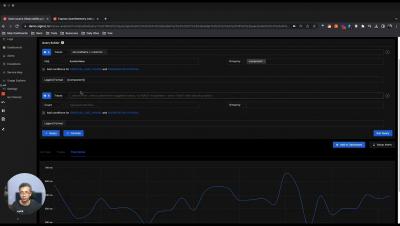
Prometheus Query Tutorial with examples

Monitoring tools are only as good as the range and visibility they offer admins into applications’ performance. Prometheus is a metrics monitoring tool that provides a pull-based system to collect and monitor time-series samples. Once the data is collected and stored, you can use Prometheus Queries to interact with the data: select and aggregate across the provided dimensions. This article takes the reader from concept to content state about the Prometheus Query language.

MongoDB Monitoring | Beginner's Guide to MongoDB performance monitoring

In this guide, we will discuss the different aspects of MongoDB performance monitoring. MongoDB provides a set of tools and command-line utilities to monitor MongoDB instances. But first, you need to know what metrics should be monitored. Once you understand the performance metrics, you can create workflows and processes to keep a check on your MongoDB cluster’s health and performance.

Not 3 pillars but a single whole to help customers solve issues faster

Wherever you read about observability, you are told that there are "3 pillars" of observability - Metrics, Traces and Logs. An image that is generally projected is something like this. But wait a minute, why are there only three pillars, and does it really matter to the end user? At the end of the day, users are just trying to solve their problems fast.

User Experience (UX) Design: The Definitive Beginner's Guide

The importance of UX design is on the rise. Customer expectations have accelerated in the post-pandemic world. According to PwC, even when people love a company or a product, 17% of US consumers will walk away after just one bad experience. So follow along for the key considerations in this important space.