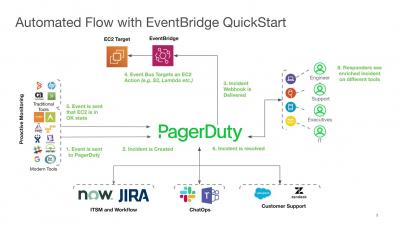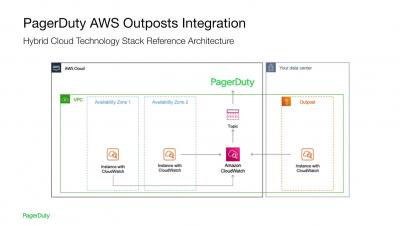
PagerDuty + AWS Outposts Integration Workflow Demo
PagerDuty for AWS Outposts empowers teams to manage incidents in real-time for AWS infrastructure used in a private data center, co-location space, or on-premises facility.


The latest News and Information on Cloud monitoring, security and related technologies.
Monitoring vs observability – is there even a difference and is your monitoring system observable? Observability has gained a lot of popularity in recent years. Modern DevOps paradigms encourage building robust applications by incorporating automation, Infrastructure as Code, and agile development. To assess the health and “robustness” of IT systems, engineering teams typically use logs, metrics, and traces, which are used by various developer tools to facilitate observability.
Even before new hybrid workforce models, many companies already moved a lot of services to the cloud. COVID-19 digital transformation strategies instantly increased the number of access points and endpoints. This led to a rapid increase in event log data followed by all kinds of other issues -- performance, availability, security, and ultimately increased IT costs amongst other things. A centralized log management solution for your cloud environment can help you manage the above and more.
In this article we explore the basics of monitoring Amazon Web Services (AWS) by feeding metrics to Grafana through Hosted Graphite’s agent and also through Hosted Graphite’s AWS add-on. This will allow us to monitor metrics from applications and servers hosted in AWS with clarity and depth. This article assumes you have created a Hosted Graphite account.
Cloud environments are susceptible to security issues. A big contributor is misconfigured resources. Misconfigured S3 buckets are one example of a security risk that could expose your organization’s sensitive data to bad actors. Policies and regular enforcement of best practices are key to reducing this security risk. However, manually checking and enforcing security is time-consuming and can fall behind with all the demands a busy DevOps team faces every day.