It’s no secret that anyone can download our open source software and run it, because — once more with feeling — open source is in our DNA. But it can be hard to set up and configure a whole stack from scratch, which is why we offer Grafana Cloud as a fully managed observability platform.
At Kubecon 2023 in Amsterdam, Azure made several exciting announcements and introduced a range of updates and new options to Azure-CNI (Azure Container Networking Interface). These changes will help Azure Kubernetes Services (AKS) users to solve some of the pain points that they used to face in previous iterations of Azure-CNI such as IP exhaustion and big cluster deployments with custom IP address management (IPAM).
Prometheus is an increasingly popular tool in the world of SREs and operational monitoring. Based on ideas from Google’s internal monitoring service (Borgmon), and with native support from services like Docker and Kubernetes, Prometheus is designed for a cloud-based, containerized world. As a result, it’s quite different from existing services like Graphite. Starting out, it can be tricky to know where to begin with the official Prometheus docs and the wave of recent Prom content.
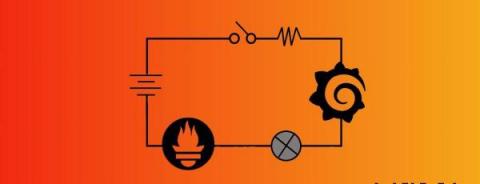
Using Prometheus and Grafana together is a great combination of tools for monitoring an infrastructure. In this article, we will discuss how Prometheus can be connected with Grafana and what makes Prometheus different from the rest of the tools in the market. MetricFire's product, Hosted Graphite, runs Graphite (a Prometheus alternative) with Grafana dashboards for you so you can have the reliability and ease of use that is hard to get while doing it in-house.
Understanding the state of your systems and their underlying infrastructure at all times is paramount for ensuring the stability and reliability of your services. Up-to-date information about the performance and health of your deployments not only helps your team react to issues in real time, but it also gives them the security to make changes with confidence and to safely forecast system failures or performance hiccups even before they occur.
In today's digital landscape, optimal web application performance is crucial for business success. Slow loading times, unresponsive pages, and inefficient code can drive away users and harm your reputation. This makes monitoring web app performance extremely important to prevent them and to provide a smooth user experience. Sitespeed, a powerful web performance monitoring framework, analyzes metrics like page load time, resource usage, and user interactions to identify performance bottlenecks.
A recently conducted survey of 51 CISOs and other security leaders a series of questions about the current demand for cybersecurity solutions, spending intentions, security posture strategies, tool preferences, and vendor consolidation expectations. While the report highlights the trends around platform consolidation over the short run, 82% of respondents stated they expect to increase the number of vendors in the next 2-3 years.
The OpenTelemetry Go project now supports automatic instrumentation via eBPF! This is a big milestone for the project and makes it significantly easier to generate data from your Go apps: The automatic instrumentation agent is still in s/alpha/beta today, but it’s ready for you to try on your applications!