AppSignal's Next Level Of Front-end Error Tracking
Today we launch the next level of AppSignal front-end error tracking. We’ve made two major improvements: line-of-code-based error grouping and sourcemapped backtraces in notifications.


Today we launch the next level of AppSignal front-end error tracking. We’ve made two major improvements: line-of-code-based error grouping and sourcemapped backtraces in notifications.
At Catchpoint, my role can be summarized at a high level as two halves: designing and taking care of Engineering teams – and working with those teams to design and take care of the various distributed systems that run our platform. I recently attended Sapphire Ventures' Hypergrowth Engineering Summit (thank you David Carter and Sapphire for the invitation!) where the sessions focused on creating and scaling high functioning engineering.
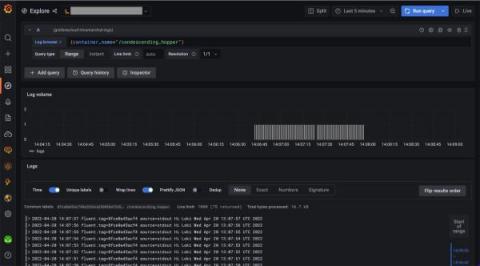
In this guide, we’ll set up an OpenTelemetry Collector that collects logs and sends them to Grafana Loki running in Grafana Cloud. We will consider two examples for sending logs to Loki via OpenTelemetry Collector. The first one shows how to collect container logs with a Fluent Forward receiver. The second one shows how to collect system logs with a Filelog receiver.
Choosing a domain name is a task that requires your full attention and should be thought about long before you undertake your website launch checklist. An inappropriate or poorly thought-through domain name is something you'll be stuck with for the foreseeable future. Domain names are tricky to change and can lead to serious SEO complications for your brand. By researching, you'll be better informed to choose a domain that works for you by maximizing website traffic and driving business revenue.
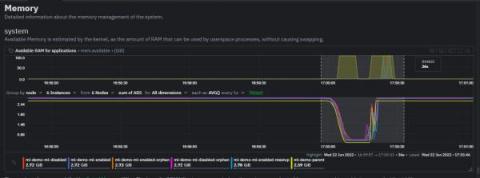
A month ago, we introduced unsupervised ML & Anomaly Detection in Netdata, the Anomaly Advisor. Today, we’re happy to announce that we’re bringing anomaly rates to every chart in Netdata Cloud. Anomaly information is no longer limited to the Anomalies tab and will be accessible to you from the Overview and Single Node View tabs as well. This will make your troubleshooting journey easier, as you will have the anomaly rates for any metric available with a single click.
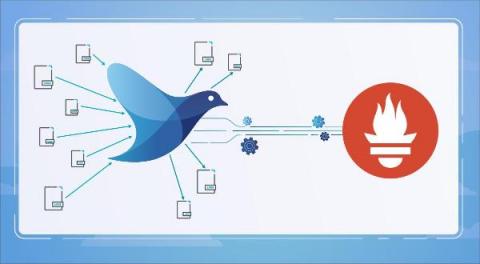
Fluentd is an open source data collector widely used for log aggregation in Kubernetes. Monitoring and troubleshooting Fluentd with Prometheus is really important to identify potential issues affecting your logging and monitoring systems. In this article, you’ll learn how to start monitoring Fluentd with Prometheus, following Fluentd docs monitoring recommendations. You’ll also discover the most common Fluentd issues and how to troubleshoot them.
As the world enters the post-pandemic era, employers and IT teams face a variety of new challenges. Some should be high on the long-term priority list. Others need to be addressed immediately. Here’s a snapshot of what we’re facing: Addressing one or two of these challenges isn’t enough. Success for the Everywhere Workplace means IT navigating all these challenges – and more – simultaneously amid considerable uncertainty.
In the first blog in this three-part series, I discussed why network compliance should be a focus for MSPs. Today I’d like to take you through what service providers can do to meet compliance requirements.
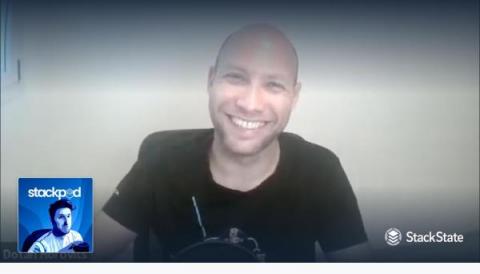
When we came across Dotan’s article “Observability Is a Data Analytics Problem” on LinkedIn, he got our full attention. We totally agree with his views on observability and data analytics.