Operations | Monitoring | ITSM | DevOps | Cloud

Latest News

Release 1.16.0: Smarter binaries and built-in TLS

We’re excited to launch release v1.16.0 of the open-source Netdata monitoring agent, which delivers real-time health monitoring and performance troubleshooting to nearly any system or application. This release also contains 40 bug fixes, 31 improvements, and 20 documentation updates—if you’d like to see the full list, check out the full release notes.

Continuous Database Monitoring

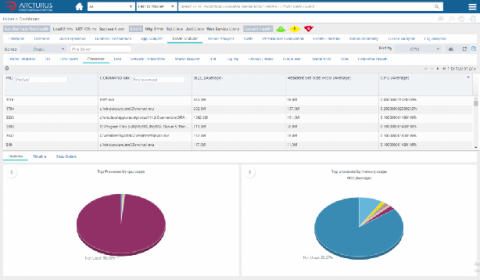
Continuous Database Monitoring is a very important aspect of enterprise applications monitoring. Database is the foundation of any application. If the performance of the database is not good then every user request can be impacted. Continuous database monitoring does provide very quick ROI. Tweaking the time consuming SQLs and any other database bottlenecks have impact on performance, scalability and availability of the entire application.

What's new in Calico v3.8

We are very excited to announce Calico v3.8. Here are some highlights from the release. You can now view IP address usage for each IP pool using calicoctl. This allows you to more easily manage the IP space in your cluster, providing a simple way to see which IP pools have addresses available and which are running low. See the calicoctl reference documentation for more detailed information on how to use this feature.

How I made AWS Lambda work for my SaaS

A big part of Checkly runs on AWS Lambda, but I never really discussed it in depth before on this blog. So here we go. Topics are: Note, I'm using "Lambda" here as a stand in for "serverless" in general. Many of the things discussed here apply to either Google Cloud Functions, Azure Functions and possibly Zeit although I've never used it. First something on how we use Lambda. Last week we went over 35 million check runs.

Building Your Observability Practice with Tools that Co-exist

A lot of product marketing is about telling people to throw away what they have in favor of something entirely new. Sometimes that is the right answer–sometimes what you have has completely outlived its usefulness and you need to put something better in its place–but a lot of the time, what’s realistic is to make incremental improvements. If you’ve been tasked with starting, or growing your observability practice, it may seem a long journey from here to there.

Identifying bottlenecks and optimizing performance in a Python codebase

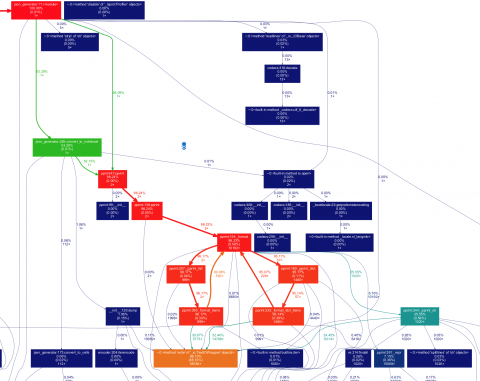
July 08, 2019 In this post, we will walk through various techniques that can be used to identify the performance bottlenecks in your python codebase and optimize them. The term "optimization" can apply to a broad level of metrics. But two general metrics of most interest are; CPU performance (execution time) and memory footprint. For this post, you can think of an optimized code as the one which is either able to run faster or use lesser memory or both. There are no hard and fast rules.

Five reasons to choose Log360, part 3: Comprehensive network auditing

In the previous post, we discussed the various environments that Log360 helps you audit and secure. Having established the ease of Log360’s use and the breadth of its auditing scope, now we’ll examine some of the critical areas it can help you monitor. With over 1,000 predefined reports and alerts for several crucial types of network activity, Log360 provides comprehensive network auditing.

Magecart Monthly: Record £183m fine for British Airways.

Read the latest news on Magecart attacks! We’ve trawled the web for the latest news of data breaches, including updates on previous attacks. Now featuring insider insights from our own Security Researcher! Latest attacks: New! Major Attack on US Medical Debt Collection company American Medical Collection Agency (AMCA). Their payment portal was compromised for 8 months from August 1st, 2018 to March 30th, 2019.

A Closer Look at Lazy Loading Grafana Dashboards

Lazy loading of dashboard panels has been a popular feature request from the Grafana community for many years, and it was finally added in v6.2. In previous versions, the moment you opened a dashboard Grafana will issue queries for every panel, even those you have to scroll to see. This can create high peaks in load to your data source backends. Meanwhile, you may never actually scroll down to look at all of those panels, so executing queries for those panels would have been pointless.