Operations | Monitoring | ITSM | DevOps | Cloud

Latest News

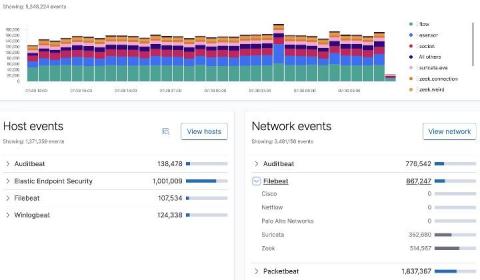
Collecting and analyzing Zeek data with Elastic Security

In this blog, I will walk you through the process of configuring both Filebeat and Zeek (formerly known as Bro), which will enable you to perform analytics on Zeek data using Elastic Security. The default configuration for Filebeat and its modules work for many environments; however, you may find a need to customize settings specific to your environment.

Logging Best Practices Part 5: Structured logging

Isn’t all logging pretty much the same? Logs appear by default, like magic, without any further intervention by teams other than simply starting a system… right? While logging may seem like simple magic, there’s a lot to consider. Logs don’t just automatically appear for all levels of your architecture, and any logs that do automatically appear probably don’t have all of the details that you need to successfully understand what a system is doing.

Q&A with Daniel Seravalli, Lead Engineer at Holler: Nailing Observability at Scale

Holler is a messaging tech company that enriches conversations everywhere by creating and delivering useful, entertaining, expressive visual content to add texture and emotion to messaging environments. As the company has continued to grow, the engineering organization has scaled to meet the demand for its services. However, without a fully staffed Operations team, most of the engineers at Holler perform double duty across DevOps to keep the service performant for consumers.

Transitioning from the ELK Stack to Logz.io in 5 Quick Steps

At Logz.io, we’ve built our Log Management solution on the ELK Stack because we know it’s what modern engineering teams prefer. It’s familiar, powerful, and integrates easily with other DevOps and cloud technologies. That’s what makes migrating from ELK to Logz.io a seamless process. This means current ELK users can easily transition to Logz.io. If you’re currently using ELK, you can ship the same data using exactly the same shipping mechanisms.

Service monitoring and availability made simple with Elastic Uptime and Heartbeat

In the world of IT, availability can mean a lot of things. Your website is available if it is up, responding in a timely manner, sending the correct headers, and serving a valid certificate. Your network is available if the correct hosts are online, responding to ICMP pings, and responding to TCP requests on specific ports. Your API endpoint is available if it returns the correct values when sent specific requests.

Sumo Logic Achieves FedRAMP-Moderate "In Process"

Sumo Logic is taking the next step towards Moderate authorization under the Federal Risk and Authorization Management Program (FedRAMP). Today Sumo moved from “Ready” to “In Process” on the FedRAMP Marketplace, an important step toward expanding our ability to serve U.S. governmental agencies. Sumo Logic expects to achieve FedRAMP-Moderate Authorization quickly while working closely with the Federal Trade Commission (FTC) as our agency partner.

Java Logging Best Practices: 10+ Tips You Should Know to Get the Most Out of Your Logs

Having visibility into your Java application is crucial for understanding how it works right now, how it worked some time in the past and increasing your understanding of how it might work in the future. More often than not, analyzing logs is the fastest way to detect what went wrong, thus making logging in Java critical to ensuring the performance and health of your app, as well as minimizing and reducing any downtime.

How Capgemini Solved Multi-Cloud Observability on Heroku/Salesforce

The modern enterprise has expanded its reach by using the power of cloud computing. However, with that power comes complexity in leveraging the multiple platforms needed to provide rich functionality. To achieve a seamless integration that involves multiple cloud infrastructures you need insightful and actionable data. You also need the right team to bring the clouds together in a seamless, effective, and efficient manner.