Operations | Monitoring | ITSM | DevOps | Cloud

Latest News

The benefits of cloud education in pandemic times

Our new Elastic for Students and Educator program provides online resources and support to help you teach and learn no matter where you are. Hear from Luis Francisco Sánchez Merchante, an educator based in Spain, as he reflects on the challenges he’s faced while teaching during a global pandemic.

Splunking Slack Audit Data

The Slack Audit Logs API is for monitoring the audit events happening in a Slack Enterprise Grid organization to ensure continued compliance, to safeguard against any inappropriate system access, and to allow the user to audit suspicious behavior within the enterprise. This essentially means it is an API to know who did what and when in the Slack Enterprise Grid account. We are excited to announce the Slack Add-on for Splunk, that targets this API as a brand new data source for Splunk.

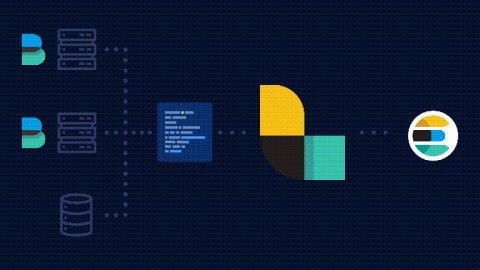
A practical guide to Logstash

Logstash is a tool to collect, process, and forward events and log messages and this Logstash tutorial will get you started quickly. It was created by Jordan Sissel who, with a background in operations and system administration, found himself constantly managing huge volumes of log data that really needed a centralized system to aggregate and manage them. Logstash was born under this premise and in 2013 Sissel teamed up with Elasticsearch.

Tutorial: Elasticsearch Snapshot Lifecycle Management (SLM)

Let’s face it, nothing is perfect. The better we architect our systems, though, the more near-perfect they become. But even so, someday, something is likely to go wrong, despite our best effort. Part of preparing for the unexpected is regularly backing up our data to help us recover from eventual failures and this tutorial explains how to use the Elasticsearch Snapshot feature to automatically backup important data.

CI/CD Detection Engineering: Splunk's Security Content, Part 1

It's been a while since I've had the opportunity to take a break, come up for air, and write a blog for some of the amazing work the Splunk Threat Research team has done. We have kept busy by shipping new detections under security-content (via Splunk ES Content Update and our API). Also, we have improved the Attack Range project to allow us to test detections described as test unit files.

Prometheus vs Nagios

Production environment stability and high availability are the holy grail of every SaaS company. R&D organizations put a lot of effort into achieving these goals by implementing different monitoring and alert methodologies and by utilizing a variety of systems and tools. Mean-time-to-detect (MTTD) and mean-time-to-repair (MTTR) are two crucial KPIs that help R&D management personnel determine the efficiency and proficiency of their teams’ responses to production incidents.

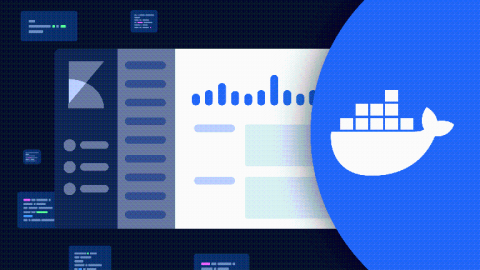
Managing Docker Logs with ELK and Fluentd

This article provides an overview of managing and analyzing Docker logs and explores some of the complexities that may arise when looking through the log data. We will go through the default logging approach, as well as look at some more advanced configurations that will make diagnosing issues in your Docker-hosted applications much easier going forward.

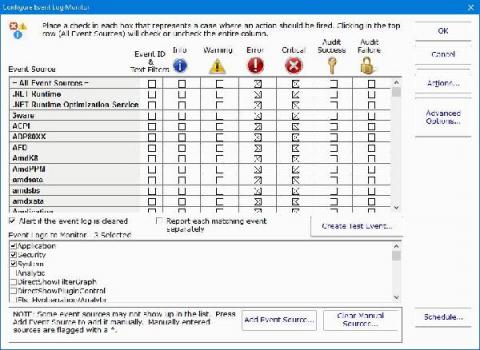
Server Monitoring and Alerts - Getting Past Common Obstacles

Keeping a server running optimally on a consistent basis involves managing multiple system elements simultaneously. Automated scripts and specialized software can handle the tasks your server needs to complete on a daily basis—but when one of these experiences an error, it can throw the entire system off.

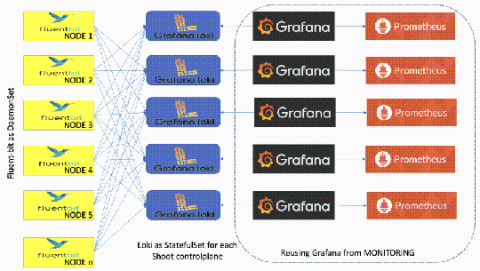
Gardener, SAP's Kubernetes-as-a-service open source project, is moving its logging stack to Loki

Kristian Zhelyazkov is a developer at SAP working on Gardener, the SAP-driven Kubernetes-as-a-service open source project. In this guest blog post, he explains why the project is moving its logging stack to Loki.