Operations | Monitoring | ITSM | DevOps | Cloud

Latest News

Tame observability complexity: Understanding the observability tool landscape

Choosing, deploying, maintaining, and rationalizing observability and monitoring tools can be a constant challenge for ITOps, DevOps, and SRE teams. As teams monitor increasingly complex systems, the need for instrumentation that monitors those systems grows at the same rate, leading directly to a growing problem of observability data engineering, integration, and enrichment.

What Is Observability? Key Components and Best Practices

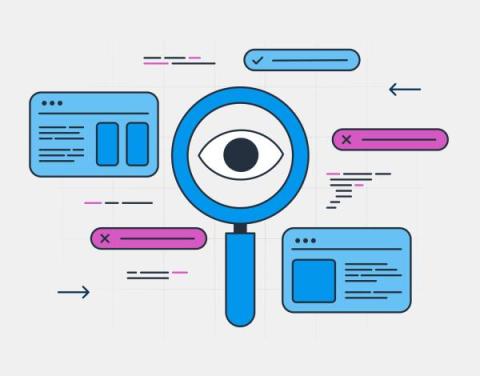
Software systems are increasingly complex. Applications can no longer simply be understood by examining their source code or relying on traditional monitoring methods. The interplay of distributed architectures, microservices, cloud-native environments, and massive data flows requires an increasingly critical approach: observability.

Best practices to scale and modernize your observability strategy

ObservabilityCON 2023 took place in London this week, showcasing all the latest and greatest trends in open source observability. Following the opening keynote, the event featured a range of breakout sessions — led by both Grafana Labs experts and members of the Grafana OSS community — that explored observability best practices and lessons learned.

Reach new heights in business excellence with full-stack observability

Organizations are constantly looking to grow and expand, which requires establishing strong foundations, especially for the IT infrastructure. The challenge in achieving this is to consistently push the limits of the IT infrastructure to deliver more business excellence. To ensure success, management operations should be fine-tuned, and this often requires improving tool sets, skillsets, and personnel.

How To Save Money On Your Observability Costs

In today's digital age, the complexity and scope of dynamic system architectures are expanding at an unprecedented rate. As a result, IT teams find themselves grappling with the challenge of monitoring and addressing conditions across multi-cloud environments. With the increasing complexities, IT operations, DevOps, and SRE teams are searching for enhanced observability within these multifaceted computing environments.

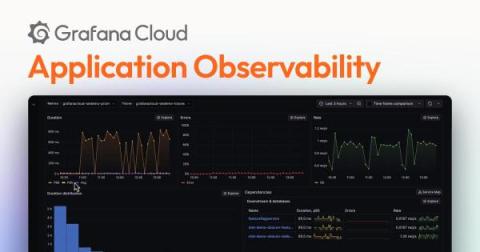
Announcing Application Observability in Grafana Cloud, with native support for OpenTelemetry and Prometheus

The Grafana LGTM Stack (Loki for logs, Grafana for visualization, Tempo for traces, and Mimir for metrics) offers the freedom and flexibility for monitoring application performance. But we’ve also heard from many of our users and customers that you need a solution that makes it easier and faster to get started with application monitoring.

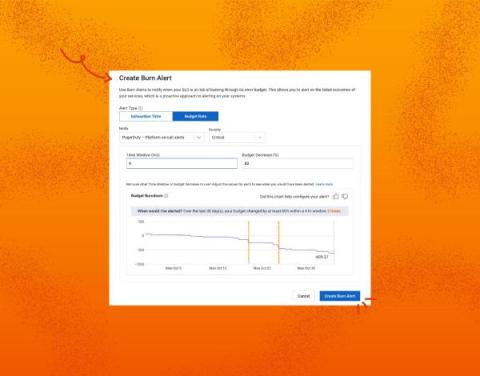
From Oops to Ops: SLOs Get Budget Rate Alerts

As someone living the Honeycomb ops life for a while, SLOs have been the bread and butter of our most critical and useful alerting. However, they had severe, long-standing limitations. In this post, I will describe these limitations, and how our brand new feature, budget rate alerts, addresses them. We usually don’t have SREs writing product announcements, but I’m so excited about this one that I said, “Screw it, I’m doing it!”

Cisco Cloud Observability on AWS: Deploying is easy with the AppDynamics add-on for Amazon EKS Blueprints with Terraform

Quickly deploy the Cisco AppDynamics Kubernetes® and App Service Monitoring solution for cloud native application observability using Helm charts and Amazon EKS Blueprints for Terraform module. In this blog, I’ll show you how to deploy the AppDynamics Kubernetes and App Service Monitoring solution for cloud native application observability using Helm charts and the Amazon EKS Blueprints for Terraform module. Now, you can do it in just minutes.