Operations | Monitoring | ITSM | DevOps | Cloud
Latest News
Navigating Observability Trends in 2024: Strategies for Success
For businesses reliant on customers’ positive digital experiences to achieve their goals, the seamless operation of cloud applications and infrastructure is paramount for financial success. Observability holds a pivotal role in modern enterprises, offering critical insights into your IT system’s health and performance. However, persistent issues of complexity and high costs have plagued the observability landscape.
Shifting Observability Left - Empowering Developers
This is the first post in a 3-part series about shifting Observability left. When it comes to the reliability and performance of your applications, compromise is not an option in the world of software development. This is where observability can help developers achieve a more robust and scalable infrastructure.
From complexity to cohesion: OpManager Plus brings IT teams together through observability
The Advent of Monitoring, Day 10: Better Observability Into Your Local Clickhouse Instance With Grafana and Prometheus
Cloud-based database providers often provide great observability out of the box. But, what if you’re developing a tricky feature locally and need more details about what your local Clickhouse is doing? There are many options, but if you’re a numbers and graphs person like me, you’ll want to be able to view the inner workings of Clickhouse in something like Grafana.
Introducing Honeycomb's Microsoft Teams Integration for Enhanced Alert Management
Today marks an exciting milestone at Honeycomb, and we're thrilled to share it with you. We officially launched our integration with Microsoft Teams, a step forward in our continuous effort to streamline and enhance your observability experience. Teams now joins our growing list of over 100 Honeycomb integrations.
Coralogix vs Observe: Support, Pricing, Features & More
Observe is a SaaS based observability tool built on Snowflake. It offers a graph-style approach to observability data, claiming that this makes it easier to correlate data in a seamless fashion. Let’s see how Observe compares to Coralogix.
LLM Monitoring and Observability
Large Language Models (LLMs) are advanced artificial intelligence models designed to comprehend and generate human-like language. With millions or even billions of [parameters, these models, like GPT-3, excel in natural language processing, understanding context, and generating coherent and contextually relevant text across various applications.
Database Observability Provides the Features Customers Need for Effective Monitoring
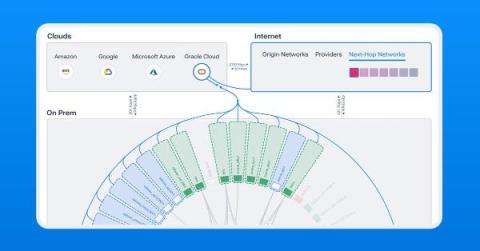
Kentik Expands Hybrid Cloud Observability with OCI Support
Kentik now provides network insight into Oracle Cloud Infrastructure (OCI) workloads, allowing customers to map, query, and visualize OCI, hybrid, and multi-cloud traffic and performance.


