Operations | Monitoring | ITSM | DevOps | Cloud

Latest News

Committed to Observability Excellence: Logz.io's Open 360 Observability Platform Takes Home Over a Dozen Winter G2 Badges

As we continue to iterate and help organizations meet their observability goals, Logz.io is thrilled to announce we’ve earned over a dozen Winter 2023 G2 Badges for our Logz.io Open 360™ essential observability platform! G2 Research is a tech marketplace where people can discover, review, and manage the software they need to reach their potential. Here are the Winter 2023 G2 Badges we’ve taken home for Application Performance Monitoring (APM) and Log Analysis.

How Observability Enhances Financial Services

Financial services and financial technology (FinTech) companies often depend upon complex infrastructure to handle their financial data. Security and compliance are paramount for these organizations, for gaining full visibility into the health and performance of these services to guarantee security is essential.

Evolving Cribl's Own Observability Practice at Blazing Speed

Cribl.Cloud has grown substantially since its launch, and our observability practice has developed in parallel. Gone are the early days of manageable logs and metrics. As we continue to grow, that problem will become even more challenging. We used Splunk internally, a well-used internal system, as our primary event management system. With Cribl Edge nodes deployed across our entire cloud fleet, we collect logs and metrics and send them to Cribl Stream for processing and routing.

Leverage Discovery Server for DX UIM to Optimize Infrastructure Observability

DX Unified Infrastructure Management (DX UIM) is a powerful solution that enables IT operations teams to monitor and manage the performance and availability of their IT infrastructure and applications. One of the key core components of DX UIM is the Discovery Server probe. This probe collects, processes, and stores information about devices and applications. In this blog, we will explore some of the benefits and use cases for Discovery Server.

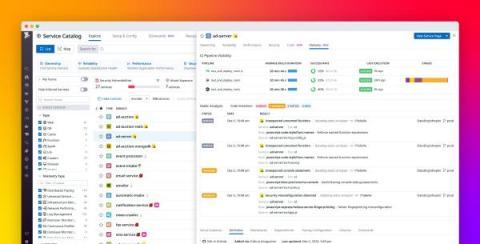
Improve your shift-left observability with the Datadog Service Catalog

Your applications are only as powerful as they are iterable. To keep up with their rapidly changing production environments, your teams need reliable CI/CD systems that implement best practices—including build and test automation, flaky test management, and deployment management. By optimizing their CI/CD pipelines, your teams can build their apps more efficiently, deploy them more safely, and catch bugs and security vulnerabilities before they make it to production.

Ship First, Model Later: A Short Recap of AI.Dev

In a keynote at AI.Dev, Robert Nishihara (CEO, Anyscale) described the shift: A year ago, the people working with ML models were ML experts. Now, they’re developers. A year ago, the process was to experiment with building a model, then put a product on top of it. Now, it’s ship a product, find the market fit, then create customized models. The general-purpose generative AI models available to all of us today (such as ChatGPT) change the way work is done.

How To Optimize Telemetry Pipelines For Better Observability and Security

Tucker Callaway (CEO, Mezmo) and Kevin Petrie (Vice President of Research, Eckerson Group) had a conversation centered around enterprises taking control of their data and the growing need for consolidated collection and management of telemetry data. They discuss how enterprises can optimize telemetry pipelines, take charge of their data, and enhance their observability and security game.

The Power of Distributed Tracing in Shifting Observability Left

This is the second post in a 3-part series about shifting Observability left. If you have not had a chance to read the first, you can find it here. In today’s complex microservices deployments, gaining visibility into deployments is vital for optimal system performance and scalability. This has become even more important as the tech industry has moved toward microservice architecture reliance. Navigating through logs has become increasingly complex as requirements have grown.

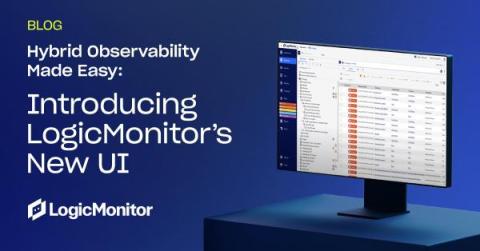
Hybrid observability made easy: introducing LogicMonitor's new UI

IT monitoring is evolving rapidly, and LogicMonitor is at the forefront of this transformation with the release of LogicMonitor’s new user interface (UI). This release marks a significant milestone, reflecting our commitment to innovation, responsiveness to user feedback, and anticipation of future technological trends.