Operations | Monitoring | ITSM | DevOps | Cloud

Latest News

Using Honeycomb for LLM Application Development

Ever since we launched Query Assistant last June, we’ve learned a lot about working with—and improving—Large Language Models (LLMs) in production with Honeycomb. Today, we’re sharing those techniques so that you can use them to achieve better outputs from your own LLM applications. The techniques in this blog are a new Honeycomb use case. You can use them today. For free. With Honeycomb.

Gartner IOCS replay: Achieving unified observability with data mesh

The single pane of glass is perhaps the most enduring and elusive goal of enterprise IT operations teams. When we polled our customers a couple of years ago, out of 184 respondents, 99% of them rated it as important to their business – with 64% indicating “extremely important”. The shared dream is to have: But unfortunately, the single pane of glass has become a bit of myth.

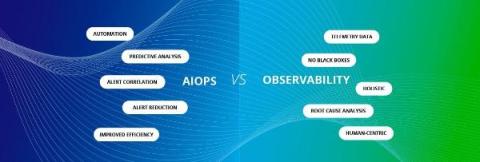
What's the Difference between AIOps and Observability?

In the ever-evolving world of IT, keeping an eye on application, service and system performance and addressing issues in real-time is crucial both to an organization’s customer experience, as well as its overall success. Two terms and approaches that have gained significant attention in recent years are AIOps and observability. While they both relate to improving IT monitoring and management, they serve distinct roles in enhancing operational efficiency.

The role of observability in incident response

Observability has brought a new approach to IT infrastructure management, easing the workload on IT admins across the world and bringing more accuracy and efficiency. One of the clear beneficiaries of this evolution in IT infrastructure management is incident response. Incident response is the systematic process of identifying, analyzing, and mitigating security threats, breaches, or operational issues to minimize their impact on the continuity of business operations.

Elastic Observability monitors metrics for Google Cloud in just minutes

Developers and SREs choose to host their applications on Google Cloud Platform (GCP) for its reliability, speed, and ease of use. On Google Cloud, development teams are finding additional value in migrating to Kubernetes on GKE, leveraging the latest serverless options like Cloud Run, and improving traditional, tiered applications with managed services. Elastic Observability offers 16 out-of-the-box integrations for Google Cloud services with more on the way.

Defensive Instrumentation Benefits Everyone

A lot of reasoning in content is predicated on the audience being in a modern, psychologically safe, agile sort of environment. It’s aspirational, so folks who aren’t in those environments may feel like the path there includes doing “the new thing” or using “the new tool.” If you write software and your employer hasn’t caught up to all the newest, best ways to work, I hope this pragmatic post helps you sleep better at night.

Multi-Cluster Observability Part 1: Building A Foundation

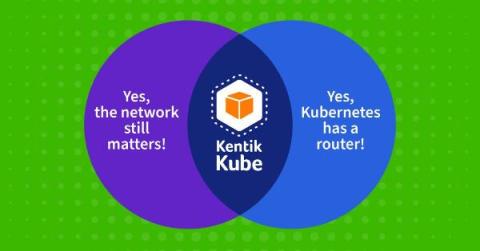
In the world of modern Kubernetes, things have come a long way from the days of a single cluster handling one app. Now, it's common to see setups that span multiple clusters across different clouds. Initially, managing those clusters was a complicated operation with many moving parts. Using tools such as SUSE Rancher, RedHat OpenShift or AWS EKS, made managing multiple clusters somewhat easier.

Kubecon 2023: Code, Culture, Community, and Kubernetes

Kubecon 2023 was more than just another conference to check off my list. It marked my first chance to work in the booth with my incredible Kentik colleagues. It let me dive deep into the code, community, and culture of Kubernetes. It was a moment when members of an underrepresented group met face-to-face and experienced an event previously not an option.

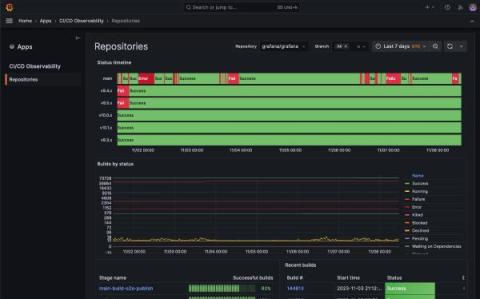
What is CI/CD observability, and how are we paving the way for more observable pipelines?

Observability isn’t just about watching for errors or monitoring for basic health signals. Instead, it goes deeper so you can understand the “why” behind the behaviors within your system. CI/CD observability plays a key part in that. It’s about gaining an in-depth view of the entire pipeline of your continuous integration and deployment systems — looking at every code check-in, every test, every build, and every deployment.