Operations | Monitoring | ITSM | DevOps | Cloud
Latest News
Leverage Discovery Server for DX UIM to Optimize Infrastructure Observability
DX Unified Infrastructure Management (DX UIM) is a powerful solution that enables IT operations teams to monitor and manage the performance and availability of their IT infrastructure and applications. One of the key core components of DX UIM is the Discovery Server probe. This probe collects, processes, and stores information about devices and applications. In this blog, we will explore some of the benefits and use cases for Discovery Server.
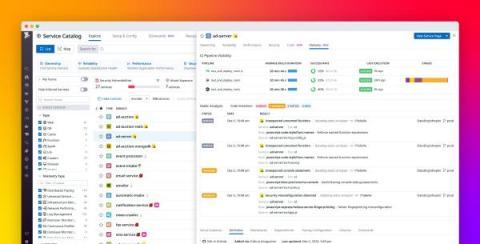
Improve your shift-left observability with the Datadog Service Catalog
Your applications are only as powerful as they are iterable. To keep up with their rapidly changing production environments, your teams need reliable CI/CD systems that implement best practices—including build and test automation, flaky test management, and deployment management. By optimizing their CI/CD pipelines, your teams can build their apps more efficiently, deploy them more safely, and catch bugs and security vulnerabilities before they make it to production.
Ship First, Model Later: A Short Recap of AI.Dev
In a keynote at AI.Dev, Robert Nishihara (CEO, Anyscale) described the shift: A year ago, the people working with ML models were ML experts. Now, they’re developers. A year ago, the process was to experiment with building a model, then put a product on top of it. Now, it’s ship a product, find the market fit, then create customized models. The general-purpose generative AI models available to all of us today (such as ChatGPT) change the way work is done.
How To Optimize Telemetry Pipelines For Better Observability and Security
The Power of Distributed Tracing in Shifting Observability Left
This is the second post in a 3-part series about shifting Observability left. If you have not had a chance to read the first, you can find it here. In today’s complex microservices deployments, gaining visibility into deployments is vital for optimal system performance and scalability. This has become even more important as the tech industry has moved toward microservice architecture reliance. Navigating through logs has become increasingly complex as requirements have grown.
Hybrid observability made easy: introducing LogicMonitor's new UI
Three Pillars of Observability [And Beyond]
Navigating Observability Trends in 2024: Strategies for Success
For businesses reliant on customers’ positive digital experiences to achieve their goals, the seamless operation of cloud applications and infrastructure is paramount for financial success. Observability holds a pivotal role in modern enterprises, offering critical insights into your IT system’s health and performance. However, persistent issues of complexity and high costs have plagued the observability landscape.
Shifting Observability Left - Empowering Developers
This is the first post in a 3-part series about shifting Observability left. When it comes to the reliability and performance of your applications, compromise is not an option in the world of software development. This is where observability can help developers achieve a more robust and scalable infrastructure.


