Operations | Monitoring | ITSM | DevOps | Cloud

Latest News

Understanding the Deficiencies of AWS CloudWatch for Cloud Visibility

While CloudWatch offers basic monitoring and log aggregation, it lacks the contextual depth, multi-cloud integration, and cost efficiency required by modern IT operations. In this post, learn how Kentik delivers more detailed insights, faster queries, and more cost-effective coverage across various cloud and on-premises resources.

Is the Internet ready for L4S?

Today, Catchpoint is pleased to be sharing the results of our Global Explicit Congestion Notification (ECN) Bleaching Rates measurement campaign, covering the state of ECN bleaching worldwide, according to Catchpoint’s perspective. ISPs, telecoms and streaming services, among others (this information should be of interest to anyone with ISP dependencies), will be able to draw on this information to determine if your network or an upstream network is experiencing ECN bleaching.

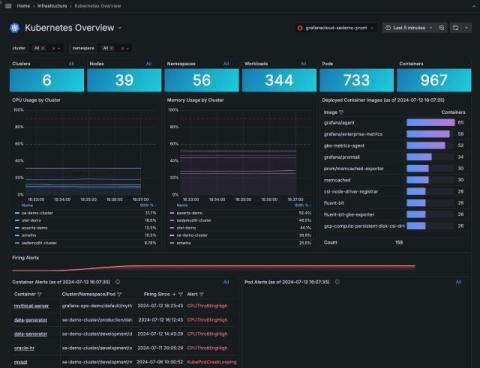
Observe deleted Kubernetes components in Grafana Cloud to boost troubleshooting and resource management

As a site reliability engineer, you need constant vigilance and a keen eye for detail if you want to manage your Kubernetes infrastructure effectively. As part of that effort, you need to see the historical data from your pods, nodes, and clusters — even after they’ve been deleted or recreated. Many SREs rely on kubectl for this, and while it’s indispensable for real-time Kubernetes management, it presents some significant challenges with historical data.

The CoPE and Other Teams, Part 2: Custom Instrumentation and Telemetry Pipelines

The previous post laid out the basic idea of instrumentation and how OpenTelemetry’s auto-instrumentation can get teams started. However, you can’t rely only on auto-instrumentation. This post will discuss the limitations in more detail and how a CoPE can help teams overcome them.

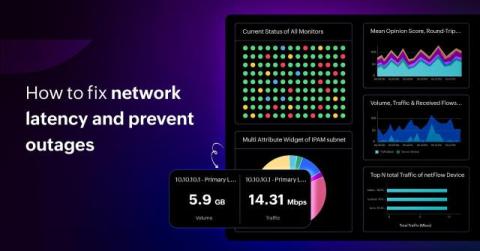
How to fix network latency with network traffic monitoring tools: Use cases and examples

Seamless network performance is the cornerstone of business success. However, network latency—the delay in data transfer initiation—can greatly hinder user experiences, decrease productivity, and even incur financial losses. For businesses aspiring to thrive, it is crucial to address and resolve network latency issues. In this context, network traffic monitoring tools emerge as pivotal solutions.

Navigating IT complexity: Observability vs. monitoring for Australian SMEs' digital transformation

While traditional IT monitoring holds back Australian small and medium-sized enterprises (SMEs) in digital transformation, these organizations do realize that in the realm of IT operations, observability represents a significant advancement over traditional monitoring approaches. Unlike conventional methods that primarily focus on metrics like uptime and error rates, IT observability provides a comprehensive view of system behavior by integrating logs, metrics, traces, and events.

Prometheus vs InfluxDB - Key Differences, concepts, and similarities

Prometheus and InfluxDB are open-source projects created to make application performance monitoring a breeze. That is, of course, if you choose the option that covers your entire observability scope. This article compares and contrasts the extent to which Prometheus and InfluxDB remedy the need for real-time insights into your applications’ operations. We’ll highlight similarities and overlaps in both usability and practicality.

IBM Power System, HMC, and VIOS Monitoring on Microsoft SCOM

We are excited to announce the release of the NiCE HMC VIOS Management Pack, designed to provide comprehensive monitoring and management for IBM’s Hardware Management Console (HMC) and Virtual I/O Server (VIOS) environments. This highly efficient tool empowers IT administrators to maintain optimal health and performance within their IBM Power infrastructure, ensuring seamless operations and minimizing downtime.

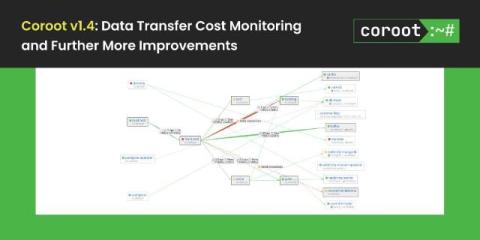
Coroot v1.4: Data Transfer Cost Monitoring and More

We’re excited to announce the release of Coroot v1.4! Along with various UI improvements, this update brings a new feature: network traffic monitoring. Now, you can easily see how much data is being transferred between your applications and, more importantly, how much it costs. Let’s dive into the details. In this post, we’ll explore the enhancements and new features included in this release.

How I cut 22.3 seconds off an API Call using Trace View

Dan Mindru is a Frontend Developer and Designer who is also the co-host of the Morning Maker Show. Dan is currently developing a number of applications including PageUI, Clobbr, and CronTool. As a developer, few things are more frustrating than an API that’s slower than molasses. You know the code works, but you know it can’t possibly be a good user experience anymore. I had one of those and looked the other way for a couple of weeks. However, some issues become personal after a while.