Operations | Monitoring | ITSM | DevOps | Cloud

Latest News

Deciphering your bandwidth usage to ensure smooth network operations

In a world where businesses require uninterrupted network operations and people rely on applications for their day-to-day activities, understanding bandwidth utilization is critical. Rather than playing whack-a-mole with your bandwidth problems, you can monitor your network’s bandwidth usage and make informed decisions based on clear data. Bandwidth utilization metrics tell you how much data an interface, switch, or router can handle and how much data is currently passing through them.

Jaeger vs. Grafana Tempo: A Comprehensive Comparison for Distributed Tracing

When it comes to monitoring, diagnosing, and optimizing the performance of complex systems today, you can’t really go wrong with tracing tools. And while OpenTelemetry has become the go-to choice for instrumenting apps and collecting traces, there are several other options in the backend that can effectively store, manage, and analyze traces sent by OpenTelemetry. Two of these open-source tools are Jaeger and Grafana Tempo. In this article, we’ll compare and contrast the two.

Eight IT challenges faced by Australian local governments and their solution

Local governments are the bedrock of communities, ensuring a city thrives as a great place to live. Delivering vital services, building and running infrastructure, and ensuring people have adequate access to essential and emergency services alike are some of the top priorities of local governments. In the continent nation of Australia, local governance is carried out through councils that form the third tier of the government and are led by elected officials on 3-4 year terms.

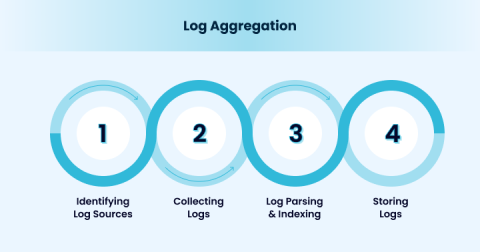
What is Log Aggregation? A Complete Guide

As modern IT infrastructure becomes increasingly complex, businesses generate massive amounts of logs compared to the past in real time. Therefore, streamlining this unstructured log data into a more structured form becomes vital with this growing complexity. Organizations must collect unstructured log data from various sources, extract meaning from them, and store them in a centralized repository. That’s where Log Aggregation comes in.

Troubleshooting Time Series Databases: Where Did My Metrics Go?

Complex modern applications rely heavily on observability, and metric monitoring is a crucial part of observability. The most common process of metric monitoring, which includes data scraping, processing, storage, and visualization, can be summarized in the diagram below: If an issue arises, for example, when users ask, “I have already recorded metrics in the application, why can’t I see my metrics on Grafana?”, how should we troubleshoot it?

Monitor Microsoft Fabric with Datadog

Microsoft Fabric is Microsoft’s new platform for all things data analytics—integrating key Azure data analysis products like Azure Data Factory, Azure Synapse, and Power BI into a unified platform. Fabric is intended to provide a one-stop shop where users with various levels of expertise across an organization can perform data analysis and collect insights.

How to Avoid Website Downtime

Website downtime refers to periods when a website is inaccessible or non-functional due to various issues. This can range from a few seconds to several hours or even days, depending on the severity of the problem and the efficiency of the recovery measures. During downtime, users cannot access the website's services or content, which can result in a loss of business and user trust.

Best Windows Server Monitoring Tools

Server monitoring involves continuously observing and tracking the performance, availability, and health of servers within an IT infrastructure and is a vital process for organizations aiming to enhance their servers. By conducting server monitoring, with the assistance of server monitoring tools, your organization can detect issues such as hardware failures or software glitches promptly allowing for quick resolutions as server monitoring tools continuously track server health and performance metrics.

Dogfooding at Mezmo: How we used telemetry pipeline to reduce data volume

Like many other organizations, we at Mezmo struggle with a lot of telemetry data, and for a while our team configured our logs to be sent to a global Mezmo Log Analysis account in our SaaS so we would have a single pane of glass to view all of our logs. Our SRE team wanted to make sure that we have experience utilizing our new pipeline product. We set out some goals before we started using telemetry pipeline.