Operations | Monitoring | ITSM | DevOps | Cloud
Latest News
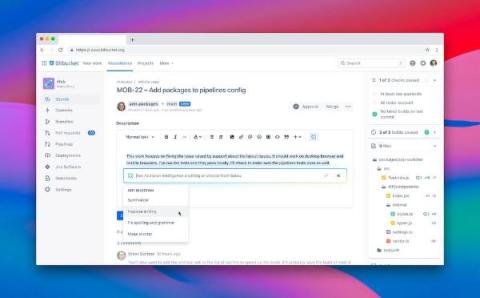
Using Helm and Terraform for Codefresh Gitops Installations
Last year we launched the Codefresh delivery platform powered by Argo. After the initial launch we started collecting feedback from all companies that tried it (as well as existing customers) and cataloged all feature requests and implementation ideas. The main goal is always to iterate quickly and address the most common issues in the most efficient way possible.
Choosing the Right Career Path in Tech: Software Engineering vs. Site Reliability Engineering (SRE)
The tech industry is booming, and there are many different career paths. But, two of the most popular and in-demand roles are Software Engineering and Site Reliability Engineering (SRE). Site Reliability Engineering (SRE) blends elements of software engineering with IT operations, focusing on reliability. On the other hand, SWE Software Engineering involves designing, developing, testing, and deploying software applications.
The Top Cloud Cost News From September 2023
What is a smartNIC and how is the technology shaping modern data centres?
Office 365 Services Overview
Microsoft Office 365, often simply referred to as Office 365, represents a significant shift in the way we approach work in a digital environment. It’s a subscription service that ensures you always have the most up-to-date modern productivity tools from Microsoft. This suite of services and applications goes beyond the traditional software suite to offer a wide range of tools and solutions to modern-day challenges faced by organizations and individuals alike.
Testing a Spring Boot API with SpringBootTest and CircleCI
When it comes to building and delivering modern web applications, the importance of continuous integration cannot be overemphasized. With the rapid pace of software development, ensuring that every change in your codebase is thoroughly tested and seamlessly integrated into your project is essential for maintaining a robust and dependable application.
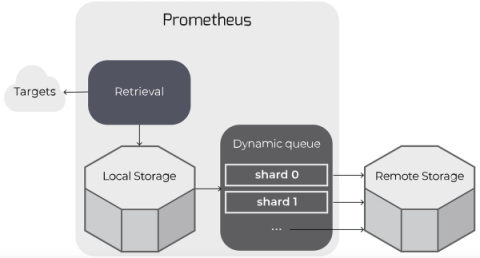
Prometheus Remote Storage
Prometheus can be configured to read from and write to remote storage, in addition to its local time series database. This is intended to support long-term storage of monitoring data.
Monitoring your infrastructure with StatsD and Graphite
Collecting metrics about your servers, applications, and traffic is a critical part of an application development project. There are many things that can go wrong in production systems, and collecting and organizing data can help you pinpoint bottlenecks and problems in your infrastructure. In this article, we will discuss Graphite and StatsD, and how they can help form the basis of monitoring infrastructure.
Our Favorite Grafana Dashboards
Grafana is an open-source visualization and analytics tool that lets you query, graph, and alert on your time series metrics no matter where they are stored - Grafana dashboards provide telling insight into your organization. All data from Grafana Dashboards can be queried and presented with different types of panels ranging from time-series graphs and single stats displays to histograms, heat maps, and many more.


