Operations | Monitoring | ITSM | DevOps | Cloud

Latest Videos

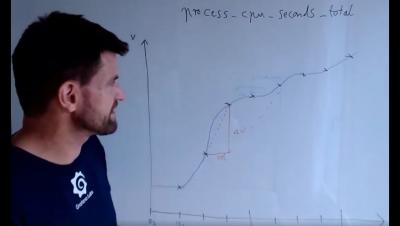
GrafanaCONline: Prometheus rate queries in Grafana

Which range to use in a Prometheus rate query is already a bit of rocket science. When Grafana enters the game to visualize the result of such a query, things get even more interesting. In most cases, you’ll end up with a dynamic range, but navigating the many available settings for it is sometimes a bit daunting. But do not despair, this talk will teach you all you have to know, even in case when you add to the mix recording rules, which are blissfully ignorant of any dynamic range requested by Grafana.

GrafanaCONline: How to get an organization to adopt a central telemetry solution

One of the main objections to adopting a centralized telemetry offering that we hear is that “I need this obscure feature from insert your favorite vendor.” So, how did we drive broad adoption of a centralized telemetry solution built in-house using open source software? For a large organization, it’s not just a technical challenge, but also an organizational one. In this talk, I will present the approach we took to convince the 6,000+ engineers at Bloomberg to adopt a new and growing platform. I will discuss some of our key decisions and trade-offs, as well as share the lessons we learned during our four-year journey.

Coffee Break: Citrix Monitoring with GripMatix

You may have heard that Citrix announced EOL for multiple SCOM MPs as of June 2020. This month we are joined by Adam Kinniburgh, Lead Evangelist at SquaredUp along with Merijn Overgaauw and Marc van der Veer, Citrix specialists and Product Architects at GripMatix, for a Q&A style discussion on Citrix Monitoring.

Coffee Break: Citrix Monitoring with GripMatix

You may have heard that Citrix announced EOL for multiple SCOM MPs as of June 2020. What are the alternatives? This month we are joined by Adam Kinniburgh, Lead Evangelist at SquaredUp along with Merijn Overgaauw and Marc van der Veer, Citrix specialists and Product Architects at GripMatix, for a Q&A style discussion on Citrix Monitoring.

Dynamic presentations with Canvas

Canvas is data visualization and presentation tool that sits within Kibana. It allows us to pull live data directly from Elasticsearch and combine it with colours, images and text in order to create dynamic and visually appealing presentations. This talk will cover the basics of building your first presentation based on the live data from Elasticsearch. If you enjoy immersing yourself in the creative process while applying your technical skills, you should join us for this talk.

Elastic Observability Engineer Training Preview: Structuring data

Hello! This session will be delivered virtually by Tamara Rosini and Lutf Ur Rehman, Education Engineers at Elastic. They will guide us through the new Elastic Observability Engineer course while providing tips on how to structure data properly as an observability best practice. Properly parsing and structuring your data is an important first step in building an efficient and effective observability solution using the Elastic Stack. Effectively indexing and structuring data into Elasticsearch is critical for establishing efficient search criteria and effective results.