Operations | Monitoring | ITSM | DevOps | Cloud

Latest Videos

Is too much data making your job harder? #youtubeshorts #dataanalytics #observability

What happens when capturing vast amounts of data becomes overwhelming instead of insightful? For years, vendors have prioritized collecting vast metrics, boasting thousands of data points. But is this approach beneficial, especially for developers who may not be observability experts? Understanding metrics shouldn't feel like deciphering a foreign language. Coroot is an open source observability platform that helps engineers fix service outages and even prevent them. It continuously audits telemetry data to highlight issues and weak spots in your services.

Azure FinOps Tool to Analyze and Optimize Azure Costs

Turbo360 is an Azure FinOps tool designed to provide a clear view of cost trends through in-depth analysis across multiple subscriptions in a comprehensive dashboard. This powerful platform empowers finance and engineering teams with transparency into cloud spending, enabling effective cost optimization with business context.

Ribbon Voice Network Transformation - The Savings Pay for the Conversion

Ribbon's Fixed Network Transformation solutions consolidate and modernize infrastructure, eliminating inefficiencies. Ribbon provides solutions to transform both the core IP and optical networks and the IP-based communications services that run on top of that network, helping service providers expand and improve business services as well as enter new markets like unified 5G xhaul and broadband backhaul. At the same time, these transformations reduce the cost and complexity of delivering traditional residential communications services by dramatically reducing recurring power, HVAC, space, and staffing costs.

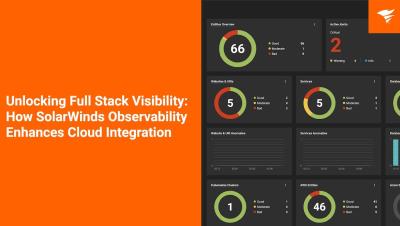
Unlocking Full Stack Visibility: How SolarWinds Observability Enhances Cloud Integration

Resolving an incident before end users are impacted is the new standard, but managing separate observability and incident management solutions is tempting fate. You are at risk of an issue slipping through the cracks. It's time to consolidate, streamline, and decomplexify your operations. Hybrid Cloud Observability combined with SolarWinds Observability and SolarWinds Service Desk make all of this much, much easier.

From DevOps to Platform Engineering: The Next Evolution

As organizations continue to navigate the complexities of modern IT environments, the evolution from “DevOps” to “platform engineering” has emerged as a crucial next step in maximizing operational efficiency. By reimagining DevOps as platform engineering, organizations can create a more cohesive and streamlined approach to IT operations and development, breaking down the silos that often impede progress. In this webinar, the Cloudsmith team will explore Omdia’s latest Market Disruptors Report and discuss which critical success factors you need to consider before making the transition to platform engineering.

How to Send Grafana Alloy Logs to Grafana Loki | Ask the Experts | Grafana

In this video, Matt Durham, Sr. Software Engineer on the Grafana Alloy team, shows you how to send Grafana Alloy logs to Loki. Specifically, we address the question: "Is it possible to send data from one Grafana Alloy to another? Could anyone supply me with config examples of such interactions? If I send data from Grafana Alloy directly to Loki, it is working. If I send data from Grafana Alloy to another, and then to Loki, the second instance gives me an error.".

From Factory Floor to Your Door: The Sneaker's Journey | Zebra

This video explores the journey a sneaker takes from the Factory, to the Warehouse and ultimately to the Retail Store. Get a behind the scenes look at 6 demos featuring solutions around Machine Vision, RFID, Intelligent Automation, Fixed Industrial Scanning, Loss Prevention and Store Associate Enablement/Order Fulfillment. Discover how Zebra’s innovative products and solutions enhance operational efficiency, accuracy, and customer satisfaction, making everyday life better for organizations, their employees, and those they serve.

Network Performance Dashboard

In this dashboard tutorial video, we will walk you through building a Network Performance dashboard. This dashboard provides users with the visibility they need into the status of their network performance from their offices down to an individual users device. Obtaining this single pane of glass visibility is made easy with the combination of both CloudReady and Service Watch metrics into dashboards. When utilizing these dashboards, users can quickly identify which networks are performing poorly, allowing them to quickly resolve issues and ensure end users have an optimal experience.