Operations | Monitoring | ITSM | DevOps | Cloud
Eight Cybersecurity Tips for Businesses in 2023
The online playing field for businesses in multiple niches has expanded, with the internet enjoying an overarching presence in various facets. New and larger markets have become more accessible through online platforms. All an established business needs is computer-based tools and an internet connection that won’t falter. Expansion is often rewarding but has its fair share of risks; thus, melding a nice blend of cybersecurity with a growing company is the safe way to go about it.
Monitor your mobile tests with Sofy's offering in the Datadog Marketplace
As your apps scale, testing can become repetitive, manual, and time-consuming, leading to slower release cycles and lower-quality code. Sofy is a SaaS platform that enables you to create and run automated tests on your mobile apps without writing any code. Sofy will automatically test your mobile apps on real iOS and Android devices, so you can optimize their performance and debug end-user experiences without setting up or maintaining your own test infrastructure.
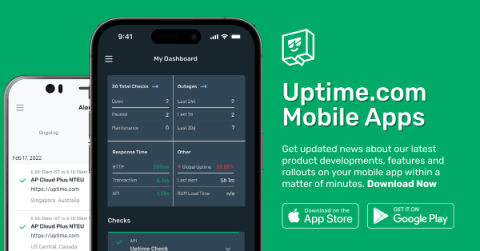
How Mobile Apps for Website Monitoring Can Improve User Experience
Imagine being on a relaxing vacation, the waves lapping at your feet, a drink in hand, and then you hear a gentle ping from your phone. Uh oh… what now? This alert is not an annoying email or a distracting message, but a digital fire alarm informing you that your website is down. Vacation time is over—time to find your laptop and some Wi-Fi.
SIGNL4 Onboarding: Alert Escalation
SIGNL4 Distribution Rules Deep Dive
The Android 14 Enterprise Features You Should Know
Android 14, Google’s latest release, brings a host of improvements for users, with enhancements to accessibility, localization, battery life improvements and more. But for IT admins, there are also several Android 14 enterprise features to plan for that enhance user privacy and control.


