What is Network Detection and Response and How Does it Work?
For the sake of security, performance and uptime, IT pros must find problems on the network immediately and fix them fast. Hmm. Sound like network detection and response (NDR)? It is.


The latest News and Information on Monitoring for Websites, Applications, APIs, Infrastructure, and other technologies.
For the sake of security, performance and uptime, IT pros must find problems on the network immediately and fix them fast. Hmm. Sound like network detection and response (NDR)? It is.
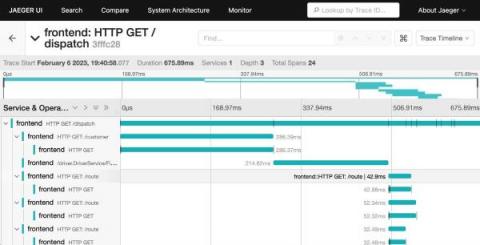
Jaeger’s HotROD demo has been around for a few years. It was written with OpenTracing-based instrumentation, including a couple of OSS libraries for HTTP and gRPC middleware, and used Jaeger’s native SDK for Go, jaeger-client-go. The latter was deprecated in 2022, so we had a choice to either convert all of the HotROD app’s instrumentation to OpenTelemetry, or try the OpenTracing-bridge, which is a required part of every OpenTelemetry API / SDK.
You don’t often see real change, but when you do see it you know it. Artificial Intelligence/Machine Learning toolsets like ChatGPT are finally starting to offer broad capabilities that will benefit a mass audience. These tools are moving out of the domain of data scientists and math nerds and into mass markets with a little bit for everyone. The potential reach is awesome and a little scary.
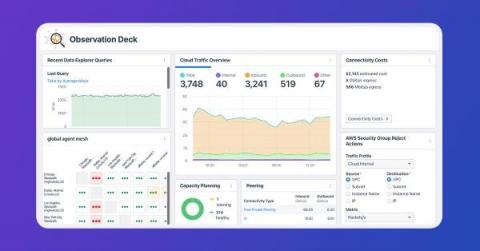
Traffic telemetry is the data collected from network devices and used for analysis. With traffic telemetry, engineers can gain real-time visibility into traffic patterns, correlate events, and make predictions of future traffic patterns. As a critical input to a network observability platform, this data can help monitor and optimize network performance, troubleshoot issues, and detect security threats. However, traffic telemetry can be difficult to understand.
If you’re an Icinga user, you already know the importance of having a streamlined and efficient configuration management process. With the release of Icinga Director Branches v1.3, this process just got even better! In this latest version, Icinga Director introduces several enhancements to its branching system, making it even easier to manage and deploy your Icinga 2 configurations.
A couple months ago, we launched Profiling in alpha for users on Python and Node.js SDKs — today, we’re moving Profiling for Python and Node.js to beta. Profiling is free to use while in beta — more updates to come when we near GA. Profiling is a critical tool for helping catch performance bottlenecks in your code. Sentry’s profiler gets you down to the exact file/line number in your code that is causing a slow-running query.