Operations | Monitoring | ITSM | DevOps | Cloud
Monitoring
The latest News and Information on Monitoring for Websites, Applications, APIs, Infrastructure, and other technologies.
Troubleshooting Firewall Issues in DigitalOcean
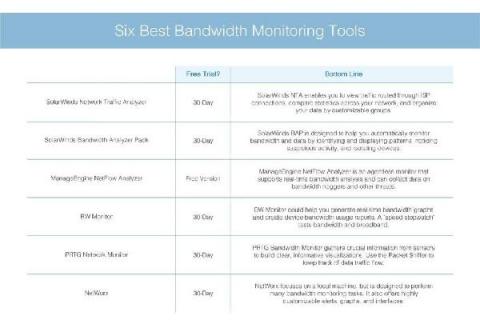
How to Monitor Router Traffic: 6 Router Monitoring Tips
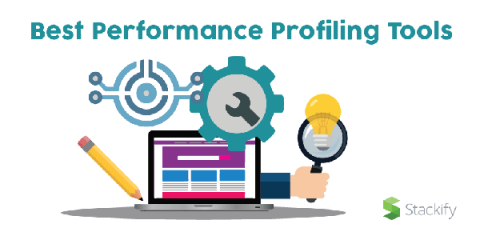
How to Choose the Best Performance Profiling Tools
You finish writing your code and launch your application. Then, you begin experiencing performance issues. How can you fix this? It doesn’t matter how talented your development team is, every code should always be analyzed, debugged, and reviewed to make it run faster. What you need is a performance profiling tool. In this article, you will learn about performance profiling and how to determine the best performance profiling tools for your software.
How Can I Silence Alerts?
Yes, there is the ability to silence or disable alerts in Graylog. There are times in IT environments where you know you are going to generate specific events in your network. As an example, you are patching servers, upgrading hardware components, and many other things. These types of activities are very common during maintenance windows.
Are We Starting A Text Editor Holy War?
Bulk Update Multiple WebLogic WLSDM Settings via WL-OPC
When you need to change WLSDM WebLogic settings and you have so many WLSDM WebLogic domains, use the “WLSDM Configuration” page to standardize the bulk WLSDM WebLogic domains settings. WL-OPC prevents struggling with numerous tabs, unwanted confusion and saves your time with WLSDM Configurations Page! The “WLSDM Configuration” page has rich content and simple usage.
How to Extend your Monitoring with Automation and Scripting - VirtualMetric Webinar
Spring 2021 Upload
Not all the waves we make are extreme. This is our fancy way of saying that we’ve been making a lot of small, behind the scenes updates lately targeting improvements to reporting and performance. For a full rundown, check out our release updates.
Logz.io Debuts Multiple Tracing Accounts and Jaeger Architecture Visualization
Logz.io has pressed hard to align our tracing and metrics analytics capabilities over the past year. And as our technology advances, so does our service. We are announcing Multiple Tracing Accounts with Logz.io Distributed Tracing, aligning it with our logging and metrics tools. Complementing multiple data sources for metrics and logs, Logz users can segment their data according to sources and teams for better organization.


