Operations | Monitoring | ITSM | DevOps | Cloud
Monitoring
The latest News and Information on Monitoring for Websites, Applications, APIs, Infrastructure, and other technologies.
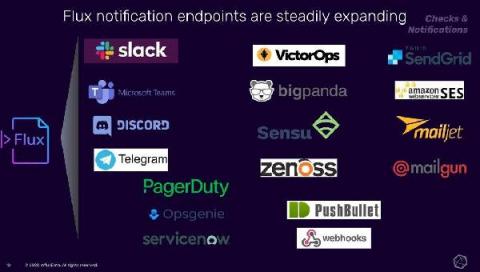
TL;DR InfluxDB Tech Tips: Configuring a Slack Notification with InfluxDB
With InfluxDB you can create notifications to make the most out of your alerts. Notifications enable you to send check statuses to the endpoint of your choice. In this TL;DR we set up a Slack Notification Rule and Endpoint through the InfluxDB UI.
Datadog acquires Sqreen to strengthen application security
We began our security journey last year with the release of Datadog Security Monitoring, which provides runtime security visibility and detection capabilities for your environment. Today, we are thrilled to announce that Sqreen, an application security platform, is joining the Datadog team. Together, these products further integrate the work of security, development, and ops teams—and provide a robust, full-stack security monitoring solution for the cloud age.
What is External Monitoring and How does it Differ From Internal Monitoring?
You likely do not own your server, but you do have an interest in making sure the applications you run on your server remain responsive. You need to know the full story, and a combination of external and internal monitoring is how you get there. Marketers understand the word “responsive” to mean “capable of rendering on any screen”, but we can think about responsive in more fundamental terms.
The challenges of monitoring a highly complex database estate at the University of the Sunshine Coast
Maximize ServiceNow with Automated Remediation
Introduction to the SQL Monitor Demo Site
What is Hardware Asset Management (HAM)? Why is it Important?
Managing hardware assets, manually, from the time they are purchased to the time they are disposed of is a tedious, cumbersome task that is susceptible to many errors. These manual and scattered processes are often inaccurate and difficult to manage. Manual data keeping means that asset information is stored in silos, which raises the overhead expenses, increases the likelihood of asset theft and losses, and makes it hard to comply with the organization’s standards and regulations.
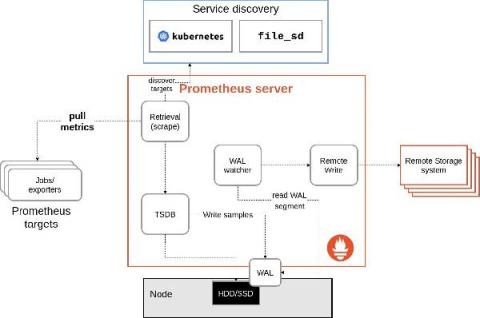
How to troubleshoot remote write issues in Prometheus
Prometheus’s remote write system has a lot of tunable knobs, and in the event of an issue, it can be unclear which ones to adjust. In this post, we’ll discuss some metrics that can help you diagnose remote write issues and decide which configuration parameters you may want to try changing. First, let’s discuss how remote write is implemented. In the past, remote write would duplicate samples coming into Prometheus via scrape.
Announcing OpenSearch: Doubling Down on Open Source
Today, I’m excited to officially announce our support for the OpenSearch project, the new fork of the Elasticsearch and Kibana codebases. As we previously shared, Logz.io has the utmost commitment to its customers and the community to ensure that these open-source technologies will prosper by being built for the community and guided by the community.


