Operations | Monitoring | ITSM | DevOps | Cloud
Monitoring
The latest News and Information on Monitoring for Websites, Applications, APIs, Infrastructure, and other technologies.
Martello Featured | Industry Recognition
The primary goal of our solutions is to help companies achieve specific business goals; whether that’s maintaining and improving the user experience and overall productivity, gaining valuable insight from enhanced visibility into your organization’s IT infrastructure, developing proactive strategies that mitigate the impact of service interruptions or issues, or all of the above, Martello is proud of the products and services we are able to provide.
A LogicMonitor Employee Reflects on Two Years of Rapid Growth
Some may consider kicking off another new year with their organization a daunting continuation of 2020, however, this is not the case with LogicMonitor. Personally, coming up on my two-year anniversary, I have felt intrinsic energy from day one. With two years under my belt at LogicMonitor, and witnessing first-hand the organization growing at a rapid rate, I thought I would reflect on the opportunity at hand for my colleagues and myself.
Series D: Moving Faster and (Not) Breaking Things
In the software lifecycle, you need to know what is affecting the customer from your frontend code to your underlying infrastructure. However, no one to date has solved for monitoring the health of software code vs. systems at the level that we have taken on — or at the scale that our customers require, as everything from grocery shopping to gaming is now digital.
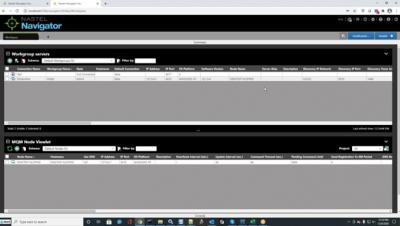
Logon Improvements with Nastel Navigator 10.1
How To - Monitor IoT with Catchpoint
In this How-To, we’re going to look at a specific Catchpoint synthetic monitor that helps you analyze the health of systems built around the Internet of things (IoT). Now, IoT is obviously a huge category, so in this case, we’re going to look at systems that utilize the Message Queuing Telemetry Transport or MQTT for short.
How to fetch data from Icinga Web
There are multiple ways to interact programatically with Icinga. Last week Henrik demonstrated how to connect to the Icinga 2 API through the Icinga 2 Console. Working with the Icinga 2 API is probably the most obvious way to interact with Icinga. Still, I would like to suggest to you another option: How you can fetch data from Icinga Web.
Getting Started with Java & OpenTelemetry
It’s easy to get started with Java and Honeycomb using OpenTelemetry. With Honeycomb being a big supporter of the OpenTelemetry initiative, all it takes is a few parameters to get your data in. In this post, I will walk through setting up a demo app with the OpenTelemetry Java agent and show how I was able to get rich details with little work by combining automatic instrumentation from the agent with custom instrumentation in the code.
What is IT Monitoring?
Introducing Splunk OpenTelemetry Java Lambda Wrapper
AWS Lambda has become a core technology in the shift to cloud-native application development, eliminating infrastructure management and fixed costs. But there are trade-offs with serverless environments. Not having access to the production infrastructure can make debugging difficult and there are a lot of moving parts, adding distributed complexity. Monitoring serverless functions in production requires observability beyond CloudWatch logs and metrics.


