Operations | Monitoring | ITSM | DevOps | Cloud

Monitoring

The latest News and Information on Monitoring for Websites, Applications, APIs, Infrastructure, and other technologies.

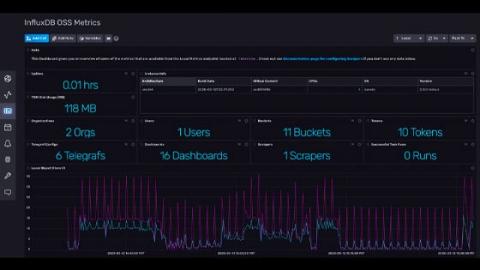
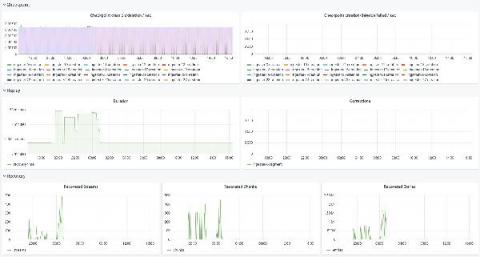
Monitoring InfluxDB 2.0 in Production and at Scale

One of the great things about InfluxDB is that it is really easy to get up and running, and it doesn’t require much monitoring when you are dealing with datasets that fit well on your local dev machine. Once you start using InfluxDB in production and pushing orders of magnitude more data into the system, it’s critical to monitor how your instance is performing so that you can proactively respond to things like disk or network failures, memory saturation, and write or query loads.

How To Track Apache Server Performance

Tracking Apache server performance is important to avoid future problems. Hence, what is Apache? Apache is one of the most popular and widely used web servers. As an open source cross platform HTTP server, it can be run in a Linux, Unix, or Windows environment. Stable modular Apache architecture can be configured for multiple needs and it’s crucial to provide seamless and efficient server functionality.

Graphite Dropping Metrics: MetricFire can Help!

Sometimes a seemingly well-configured and fully-functional monitoring system can malfunction and lose metrics. Subsequently, you get a distorted picture of what is happening with the monitoring object. In this article, we will look at the possible causes of Graphite dropping metrics and how to avoid it. MetricFire specializes in monitoring systems. You can use our product with minimal configuration to gain in-depth insight into your environments.

Application Performance Monitoring: Why is it important for your organization?

Application Performance Monitoring (APM) refers to monitoring or managing the performance of your code, application dependencies, transaction times, & overall user experiences. It is an important technology that ensures the computer application programs are performing as expected. The ultimate goal of performance monitoring is to supply end users with a top quality end-user experience.

An Intro to PromQL: Basic Concepts & Examples

PromQL, short for Prometheus Querying Language, is the main way to query metrics within Prometheus. You can display an expression’s return either as a graph or export it using the HTTP API. PromQL uses three data types: scalars, range vectors, and instant vectors. It also uses strings, but only as literals. This intro will provide basic PromQL examples and concepts to understand as you get used to Prometheus queries.

Azure Management Talk: 5 easy steps to apply financial management to your cloud budget

Struggling with Azure costs? How can you make your cloud consumption predictable? Tony Nguyen and Microsoft MVP Cameron Fuller will show how the same ideas which apply to personal financial management also apply to handling your cloud consumption. They will show how these principles have been successfully used for hundreds of companies across the IT landscape. When you leave this session, you will have learned the 5 steps to managing your Azure budget on any scale.

Azure Management Talk: Multi-tenant resource management at scale

In this Azure Management Talk webinar, Azure MVP Martin Ehrnst is taking a closer look at Azure Lighthouse. With Azure Lighthouse, managed service providers and enterprises can manage Azure resources cross tenants. This allows MSPs to create their own managing solutions, protecting their IP, as well as eliminating tenant switching. Enterprises with multiple tenants can benefit from the same service and manage their entire infrastructure from one single pane.

The essential config settings you should use so you won't drop logs in Loki

In this post, we’re going to talk about tips for securing the reliability of Loki’s write path (where Loki ingests logs). More succinctly, how can Loki ensure we don’t lose logs? This is a common starting point for those who have tried out the single binary Loki deployment and decided to build a more production-ready deployment. Now, let’s look at the two tools Loki uses to prevent log loss.

Close the Loop with User Feedback

Everyone’s software crashes. As an engineer, you don’t feel your users’ frustration unless they reach out to customer support, write bad reviews, or tweet about it. This feedback is often lacking relevant information to resolve the issue. In some cases, you can re-engage with the customer, but that process is time-consuming and inefficient. Another option would be to examine the crash reports, but sometimes they don’t give sufficient insight to fix the problem.