Operations | Monitoring | ITSM | DevOps | Cloud

Monitoring

The latest News and Information on Monitoring for Websites, Applications, APIs, Infrastructure, and other technologies.

The best complement for an IoT solution using a Raspberry Pi

Pandora FMS is a proactive, advanced, flexible and easy-to-configure monitoring tool according to each business. It gets integrated into all the needs of servers, network computers, terminals and whatever needs to be monitored. In this article, we will focus on monitoring openHAB (Smart Home Solution), using the software agent installed on our Raspberry Pi (this article applies to both Pandora FMS Community and Enterprise versions).

How AXA Investment Managers Supports User Experience

The head of AXA IM’s proximity services discusses the importance of creating a digital experience during the lockdown in France. I remember a discussion I had with a senior manager at AXA Investment Managers (AXA IM) right at the beginning of what in France has been termed the “confinement” – or “lockdown” in the UK.

Paul Hardy (ServiceNow): The Changing Role of IT

Our customers often stress the phenomenal power that comes from the integration of Nexthink and ServiceNow. Bernardo Ramos, for example, former Director of IT for Arkema, saw their integration as a way of getting real-time information on all their workstations automatically and without effort. “With ServiceNow I had the feeling of having something the best of its class,” he told us, shortly before his retirement earlier this year.

Introducing the Splunk Observability Suite

Today is an exciting day for Splunk! In just 12 months since the acquisition of SignalFx and Omnition, our vision of a fully integrated Observability Suite is now a reality! As IT and DevOps teams strive to keep up with ever changing business requirements and deliver flawless customer experiences, we’re seeing the pace of digital and cloud initiatives accelerate.

Splunk Log Observer: Fast and Powerful Log Investigation for DevOps Teams

When it comes to DevOps, Splunk has a lot to say at .conf20. There’s a lot to digest from new product names to introducing new products to create a complete observability experience. We announced the Splunk Observability Suite, which creates a seamless workflow across monitoring, investigation and troubleshooting tasks. We also extended our portfolio with Splunk Real User Monitoring, which provides front end engineers better insights into performance.

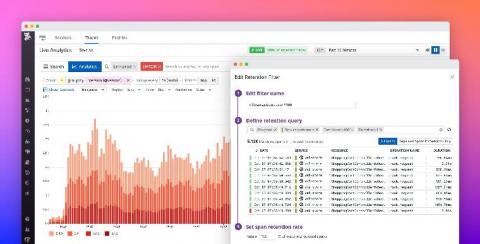
Tracing without Limits: live-query all traces, retain only the ones you need

Tracing is a critical part of monitoring application performance, especially as organizations shift to deploying services using distributed systems, serverless computing, and containerized environments. Teams need real-time, end-to-end visibility into all of the traces relevant to performance issues such as an application outage or an unresponsive service, but managing tracing costs often results in gaps in valuable tracing data.

Night of the Runbooks: a DevOps Horror Story

It was a dark and stormy night. Not really, of course; it was warm and pleasantly mild (the weather never seems to co-operate on these occasions), but indulge me by imagining appropriate meteorological conditions for the spine-tingling story I’m about to relate. It was Morgan’s very first night on call, and they were a mite nervous, as you can imagine.

AppSignal is Free for Open-Source Software & "For Good" Projects

Whether you write code to save the bees, build the latest CMS, or teach others to become a developer: we’ve got your back. We’ve always offered AppSignal for free to maintainers and do-gooders who asked, such as Elixir School, Code::Stats and the MEANS Database. Starting today, we want to spread the word to all open-source maintainers and volunteer organizations that AppSignal is 100% free for them.