Operations | Monitoring | ITSM | DevOps | Cloud

Monitoring

The latest News and Information on Monitoring for Websites, Applications, APIs, Infrastructure, and other technologies.

Tanzu Observability by Wavefront Delivers Unified Enterprise Observability for DevOps Teams

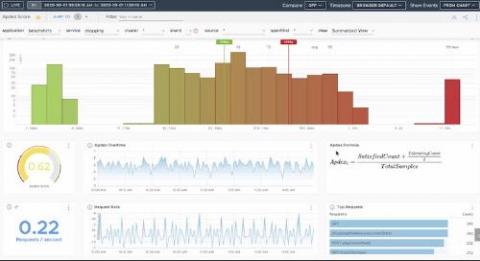
In conjunction with VMworld 2020, we are announcing new functionalities of Tanzu Observability by Wavefront that accelerate analytics-driven insights and data onboarding for DevOps teams, including developers, Kubernetes operators, and wider operations teams. We have added support for PromQL, expanded packaged application insights, and grown the Tanzu Observability ecosystem—both within the Tanzu portfolio and outside of it—by adding support for popular DevOps and developer tools.

Microsoft Teams and OpManager: The perfect team for your remote IT management game

It seems almost everything is going digital during this pandemic: businesses, education, and medical consultations. This increased digital consumption is squeezing the juice out of the IT infrastructure of many organizations. On top of that, remote work policies are posing serious security issues. At times like these, IT infrastructure monitoring is like a football game for IT admins, except: So how do you navigate all these challenges and score a touchdown?

You spoke, Microsoft listened. Ignite 2020 SCOM takeaways

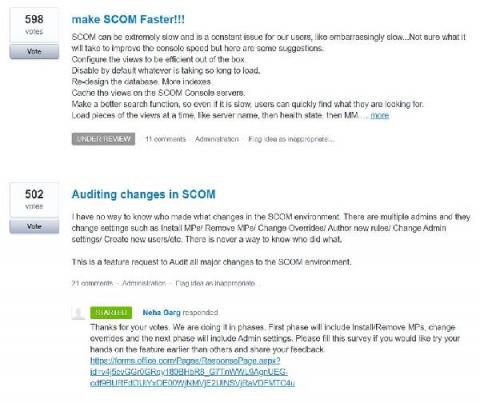
Have you ever looked at SCOM on User Voice - Microsoft’s way of collecting feedback on what end users have to say about SCOM and its future? Well good news, the top 2 items are going to be addressed! At Ignite 2020 - System Center session, Dianna Marks (SCOM Product Marketing Manager) told us Microsoft have heard your feedback and will be taking action.

New in Grafana 7.2: $__rate_interval for Prometheus rate queries that just work

What range should I use with rate()? That’s not only the title of a true classic among the many useful Robust Perception blog posts; it’s also one of the most frequently asked questions when it comes to PromQL, the Prometheus query language. I made it the main topic of my talk at GrafanaCONline 2020, which I invite you to watch if you haven’t already. Let’s break the good news first: Grafana 7.2, released only last Wednesday, introduced a new variable called $__rate_interval.

Building and Using a 2020 Status Page with Uptime.com

A hosted status page gives you the peace of mind that users can always answer one simple question: is it up or down. Hosted status pages work because they offer third-party confirmation your services are up. If your site goes down, the third party is likely not down and you can use them to refer to your status. Status pages are your personal 24 hour news cycle. Regardless of if you’re up or down, customer service fields fewer support tickets, and users praise your transparency.

Easily view your old queries with Cloud Logging recent queries

As you analyze your logs for application performance, infrastructure errors, system events, and more, sometimes you may need to look back to logs you were previously analyzing to help correlate events and identify the root cause of a problem. To help, we are excited to introduce Google Cloud Logging recent queries, to make it easy to track and run your past searches as you deep dive on your log data.

Webinar | Influencing a diverse and equitable workforce, from startups to the enterprise

In this fresh take on Allyship in the Tech space, Ingrid Hadley from ILH Possibilities and Tucker Callaway, CEO of LogDNA, will discuss the issues that the industry faces from decades of putting diversity, equity, and inclusion on the back burner. The conversation will be moderated by Alexis Ohanian, Co-founder of Reddit and Initialized Capital who is a first-round investor in LogDNA.

Searching for Unknowns

When you’re troubleshooting, issues seem to fall into two categories: issues based on an alert or error message where you have a good idea where to start and ones where you have no idea what’s going on. The first issues are usually straightforward. You use the information provided in the alert or error message to search the logs and pull up the relevant event messages.