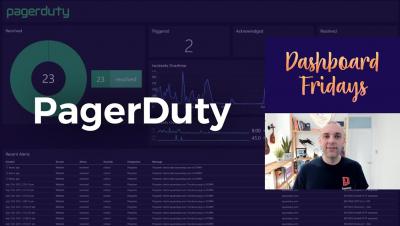
Operations | Monitoring | ITSM | DevOps | Cloud

Monitoring

The latest News and Information on Monitoring for Websites, Applications, APIs, Infrastructure, and other technologies.

How to Use Starlark with Telegraf

Our Telegraf Starlark Processor Plugin is an exciting new processor in Telegraf 1.15 that gives you the flexibility of performing various operations in Telegraf using the Starlark language. What is Starlark, you ask? Starlark (formerly known as Skylark) is a language intended for use as a configuration language. Starlark is a dialect of Python. Like Python, it is a dynamically typed language with high-level data types, first-class functions with lexical scope, and garbage collection.

New in Telegraf 1.15: Starlark, execd, Go, NGINX, Network Monitoring, Redfish, New Relic, MongoDB and More

Last week we released Telegraf 1.15 with new plugins for network monitoring and a large number of processors to help with your data ingestion. All packages were written in Go 1.14.5. This all couldn’t have been done without the 50+ community members who contributed to writing plugins, fixing bugs, reviewing code, and everything else to help make Telegraf better! Here’s a quick look into new plugins and features we launched in Telegraf 1.15.

Website Monitoring: Best Practices

In theory, the default monitoring check settings should work in the majority of cases. However, everyday practice shows that our case does not belong to this majority. Therefore, it is necessary and worthwhile to dedicate some time to the optimal configuration of monitoring. It is also important to properly prepare the monitored website and the organization itself.

Java Logging Best Practices: 10+ Tips You Should Know to Get the Most Out of Your Logs

Having visibility into your Java application is crucial for understanding how it works right now, how it worked some time in the past and increasing your understanding of how it might work in the future. More often than not, analyzing logs is the fastest way to detect what went wrong, thus making logging in Java critical to ensuring the performance and health of your app, as well as minimizing and reducing any downtime.

How to stream Graphite metrics to Grafana Cloud using carbon-relay-ng

In this post we’ll show how you can easily ship your existing Graphite metrics to Grafana’s managed metric offering using carbon-relay-ng. Carbon-relay-ng is a fast, go-based carbon-relay replacement that allows you to easily aggregate, filter and route your Graphite metrics. This post assumes you have a local carbon-relay-ng binary. You can download carbon-relay-ng binaries from the releases page and find documentation on Docker images, Linux packages, and how to build it yourself here.

Asynchronous CSV Exports with Discover

For as long as we can remember, Sentry has had some version of CSV Exports. They’ve been limited only 1000 rows of results, which did the job for the most part. However, the more you used Sentry, the more we found that limit wasn’t good enough. What if I told you there was a way to get all your data in the exports in a single CSV? That’s right, no more DIY python scripts. No more manually piecing CSVs together. No more feature-request tickets.