Operations | Monitoring | ITSM | DevOps | Cloud

Monitoring

The latest News and Information on Monitoring for Websites, Applications, APIs, Infrastructure, and other technologies.

Getting Github Data with Webhooks (Part 2)

After my last blog around sending Github Data to Splunk via Webhooks, I received a healthy amount of feedback that I want to address here. I learned that (unsurprisingly) a lot of customers are curious about, or dependant on, other cloud platforms out there. In fact, I heard directly from some customers who specifically cannot use any other cloud platforms than one in particular that was not highlighted in my last blog.

Instrument your Python applications with Datadog and OpenTelemetry

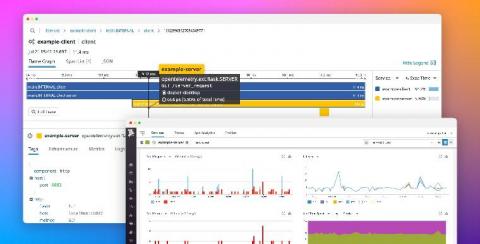
If you are familiar with OpenTracing and OpenCensus, then you have probably already heard of the OpenTelemetry project. OpenTelemetry merges the OpenTracing and OpenCensus projects to provide a standard collection of APIs, libraries, and other tools to capture distributed request traces and metrics from applications and easily export them to third-party monitoring platforms.

How to maximize span ingestion while limiting writes per second to a Scylla backend with Jaeger tracing

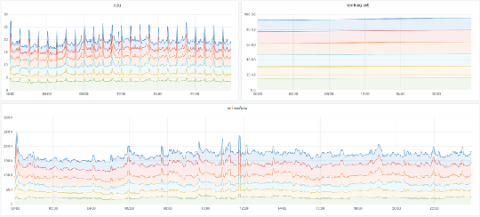
Jaeger primarily supports two backends: Cassandra and Elasticsearch. Here at Grafana Labs we use Scylla, an open source Cassandra-compatible backend. In this post we’ll look at how we run Scylla at scale and share some techniques to reduce load while ingesting even more spans. We’ll also share some internal metrics about Jaeger load and Scylla backend performance. Special thanks to the Scylla team for spending some time with us to talk about performance and configuration!

Create Customized Dashboards for End to End Visibility Over Your Entire Network

With employees scattered into an assortment of different IT environments, it can be a challenge to keep track of all the data you’re receiving from your various monitoring platforms. Using dashboards to sort and filter potential action items is an essential need of efficiently using they resources you have. In this #ITConnections session we will go over some of the best practices to creating dashboards that will effectively handle your business.

Community Highlight: How InfluxDB Enables IoT Monitoring of Gas Station Tanks

I recently spoke with Alex Skrivseth, the Operations Manager at The Shed App, and discovered how he’s using InfluxDB to monitor the current levels of gas and diesel at various gas stations. Simply by extracting IoT sensor data, he has been able to provide valuable previously inaccessible data to fuel truck drivers.

Will Black Friday 2020 be the Same as Previous Years?

Year after year, we have seen that when it comes to maintaining end-user experience during the holiday season, preparation is key. But this year promises to be different, there has never been a time where digital-first was so imperative to the survival of most retailers. The drastic changes brought in by COVID-19 is bound to have a significant impact on the holiday season. Black Friday 2020 might as well be the benchmark for DEM going forward.

Spread the Love: Appreciating Our Pollinators Community

Have you heard the buzz about observability with Honeycomb 🐝? It’s the best tool on the market for observing your systems in real time to reduce toil and delight users. But don’t listen to us, listen to our buzzing community of “Pollinators”–this blog post is dedicated to them 💖 An invite is sent to our shared Slack workspace “Pollinators” to everyone who signs up for Honeycomb.