Operations | Monitoring | ITSM | DevOps | Cloud
Monitoring
The latest News and Information on Monitoring for Websites, Applications, APIs, Infrastructure, and other technologies.
How to Report on Remote Worker Productivity and Experiences on Citrix or VMware Horizon
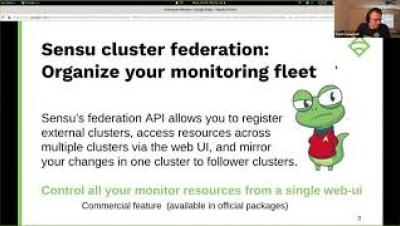
[Webinar] Understanding federation in Sensu Go
Lambda, Lambda, Lambda: Instrumenting Python Lambda Functions with AppDynamics
Learn how to monitor Lambda functions written in Python with AppDynamics Python Tracer SDK.
Monitoring for Citrix Digital Workspaces
eG Innovations has been a Citrix partner since 2003. Those were the days when Citrix’s messaging was around “access”. Thin client computing and then server-based computing were the hot topics. Discussions around the efficiency of RDP and ICA ruled and Citrix Resource Manager was the best way to monitor a Citrix server. What was then Citrix MetaFrame soon became Citrix Presentation Server, then Citrix XenApp, and now Citrix Virtual Apps.
Catchpoint Digital Monitoring: Offering lowest cost options without compromising quality
SaaS monitoring platforms must provide a flexible set of capabilities to their customers. A platform with the ability to adjust according to business needs reduces costs (e.g. the cost to switch) and tool sprawl since the need to perform different monitoring functions can be accommodated in a single place. A monitoring platform should allow you to adjust, for example: Not all digital experience monitoring platforms are the same.
Which AWS Lambda programming language should you use?
To me personally, when I think programming languages I think JavaScript and while 67% of the developers out there might think the same (at first) that does not imply it’s the most efficient language to use with AWS Lambda. So without further ado, here we go.
Reign in the Chaos of Security Threats with ChaosSearch
Logging Best Practices Part 4: Text-based logging
Isn’t all logging pretty much the same? Logs appear by default, like magic, without any further intervention by teams other than simply starting a system… right? While logging may seem like simple magic, there’s a lot to consider. Logs don’t just automatically appear for all levels of your architecture, and any logs that do automatically appear probably don’t have all of the details that you need to successfully understand what a system is doing.
Next-Gen Reporting & Analytics for IBM Spectrum Protect Added to the Galileo Suite
Simple, yet powerful metrics to determine the health and protection status of your Spectrum Protect environment in a single pane of glass.


