Operations | Monitoring | ITSM | DevOps | Cloud

Monitoring

The latest News and Information on Monitoring for Websites, Applications, APIs, Infrastructure, and other technologies.

Serverless Logging Performance, Part 2

When thinking about serverless applications, one thing that comes to mind immediately is efficiency. Running code that gets the job done as swiftly and efficiently as possible means you spend less money, which means good coding practices suddenly directly impact your bottom line. How does logging play into this, though? Every logging action your application takes is within the scope of that same performance evaluation.

Splunk Insights EOL: Infrastructure and AWS Cloud Monitoring

Two years ago we introduced Splunk Insights for AWS Cloud Monitoring and Splunk Insights for Infrastructure on the AWS Marketplace as a Pay-As-You-Go Amazon Machine Image, where you could initiate an instance and pay hourly to use these products after a 15-day trial. Assessing our portfolio, we are discontinuing these offerings to focus on differentiating capabilities, namely the ability to search and apply machine learning to your data in addition to visualizing insights.

Take website, API & server availability monitoring to the next level

People throw the terms “availability” and “uptime” around a lot, but depending on what you’re monitoring, the definition of these terms may change. In this article we use the narrow definition, accessible, to explore the various options Uptrends has for checking availability on websites, APIs, and servers.

Protect Your AWS Infrastructure with GuardDuty and Coralogix

Cloud environments like AWS can be a challenge for security monitoring services to operate in since assets tend to dynamically appear and disappear. Making matters more challenging, some asset identifiers that are stable in traditional IT environments like IP addresses are less reliable due to their transient behavior in a cloud service like AWS. Amazon GuardDuty protects your AWS environment with intelligent threat detection and continuous monitoring.

Introduction to Kibana Best Practices for Log Search and Visualizations

Kibana is a powerful and flexible tool to search and visualize your logs in Elasticsearch – but only if you know how to use it! Zach Hamilton, a Sales Engineer at Logz.io, has enabled hundreds to be successful with Kibana and will provide his insights for best practices in this webinar. Understanding Kibana’s strengths and quirks can help you more efficiently explore your log data so you can quickly understand what’s happening in your environment.

New Feature: Add Custom Metrics For Node.js in AppSignal

You can now monitor any metrics you’d like in your Node.js app with AppSignal. With custom metrics and minutely probes by your side, you’ll now have an excellent overview of your app. If you’ve ever thought “I wish we measured this specific thing so I could monitor better what is going on…”, then this feature is perfect for you.

Proving the Value of IT

There is a value perception gap in IT. It can be a struggle to get past the historical notion that IT is a cost center, rather than a strategic arm of the business. E&Y recently surveyed 300 senior IT professionals around the globe to understand how they are perceived by their C-level executives. The survey found that 67% of CIOs engage with executive peers on matters of budgetary issues and infrastructure management. Far fewer, only 36%, engage in matters of business performance and challenges.

Simplify your IT service delivery with Motadata ServiceOps

Traditionally, IT service management was limited to legacy platforms and infrastructure. Due to a lack of process, interacting with IT teams was frustrating and difficult, resulting in the workforce becoming less engaged, and the gap between the IT team and business growing even further. Since IT service management was already a complicated task for most IT teams, COVID-19 only exacerbated the repercussions.

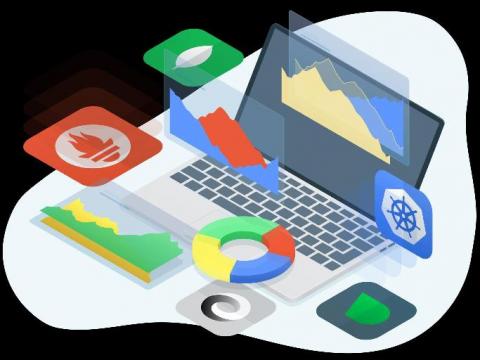
Netdata Agent v1.23: Kubernetes monitoring & eBPF observability

Deploying and monitoring performance for an entire Kubernetes cluster can be complex. To simplify the process, we’ve added service discovery functionality to eliminate complex configuration, in addition to more advanced monitoring for viewing activity inside containers. Service discovery identifies k8s pods running on a cluster and immediately starts monitoring system performance. All containers are identified, regardless of complexity.