Operations | Monitoring | ITSM | DevOps | Cloud

Monitoring

The latest News and Information on Monitoring for Websites, Applications, APIs, Infrastructure, and other technologies.

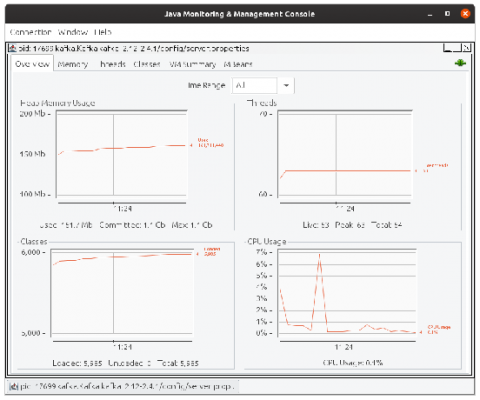
Monitoring Java applications with the Prometheus JMX exporter and Grafana

We all know that Prometheus is a popular system for collecting and querying metrics, especially in the cloud native world of Kubernetes and ephemeral instances. But people forget that Java has been running enterprise software since 1995, while Prometheus is a relative newcomer to the scene. It was only created in 2012! Even though Java has had its own metric collectors since before Prometheus was born, none of our new environments speak its (metric) language. How can you bridge that gap?

DX NetOps 20.2 Continues to Improve Visibility with Expanded SD-WAN Network Monitoring Coverage

Broadcom enhanced its analytics and monitoring capabilities in the latest release of DX NetOps 20.2 that now enables network operations teams to reliably deliver applications experiences over even more SD-WAN technologies; now including support for Silver Peak, VMware VeloCloud , Cisco Meraki, and 128 Technology.

Dogfooding Chronicles: Thinking Backward, Moving Forward

Zac Propersi, Engineering Manager at Sentry, can tell when a page is not loading as fast as it should — just by looking at it. While working on our new Metric Alerts feature, Zac noticed that the alerts pages were rendering slowly. Being the super Sentry user that he is, he wrote a custom query in Discover to see just how slow the transactions were.

How to Enable PHP Error Reporting

Errors are undesirable for users and you should do everything in your control to keep users away from them. However, they are of utmost importance for developers. They allow developers to understand the inaccuracies and vulnerabilities in their code by alerting them when their code breaks. They also provide relevant information about what went wrong, where, and what can be done to make amends.

Full Observability: From Push to Production

Understand what happens as soon as you do a code push until long after your code lands in production. Observability is looking into your code as it runs in production, and understanding the impact of your changes in real-time. With the right understanding, you make informed decisions, spending less time fixing, and more time improving. See how Codefresh and Honeycomb can help you push your code to production with confidence.

Take a Proactive Approach to Enhance your IT Operations User Experience

IT staff are consistently being flooding with problems resulting from end-user service delivery issues, requests from senior management and stakeholders, as well as attempts to make plans to future-proof their systems. By taking a proactive approach to managing your IT environment you can stop firefighting and make decisions to help increase efficiencies. This results in quicker resolution time and better user experience.