Operations | Monitoring | ITSM | DevOps | Cloud

Monitoring

The latest News and Information on Monitoring for Websites, Applications, APIs, Infrastructure, and other technologies.

Elastic Observability in SRE and Incident Response

Software services are at the heart of modern business in the digital age. Just look at the apps on your smartphone. Shopping, banking, streaming, gaming, reading, messaging, ridesharing, scheduling, searching — you name it. Society runs on software services. The industry has exploded to meet demands, and people have many choices on where to spend their money and attention. Businesses must compete to attract and retain customers who can switch services with the swipe of a thumb.

Monitor ProxySQL with Datadog

ProxySQL is a MySQL/MariaDB protocol–compliant load balancer and reverse proxy with native support for a range of popular backends including ClickHouse, Amazon Aurora, and Amazon RDS. ProxySQL efficiently distributes queries to your database servers and caches results, improving resource management and boosting database performance. You can also configure ProxySQL for high availability to reduce downtime.

5 major risks that impact vulnerable network devices

Working from home has become our new normal, with many of our jobs being performed remotely. The experience of working remotely can be as seamless as it was from our workplace, with all the technological advancements available today. Businesses have also put network security on the forefront by implementing use of virtual private networks (VPNs). This enables users to securely access confidential information hosted on the organizations’ servers.

What Is Cloud Monitoring? Features, Benefits & More

93% of businesses use cloud services, and many are looking forward to investing more in it. Which means almost everyone nowadays is using cloud in some form or another. If any part of your infrastructure is in the cloud, then you must monitor it. This article will show you the features and benefits of cloud monitoring. We’ve also covered how cloud monitoring can help in the current pandemic situation.

What's new in Pandora FMS Release 745 7.0 NG

Find out all the new features included in Pandora FMS Release 745 here. If we had to give a name to this release, we would definitely call it WUX 3.0, or the Great User Experience Monitoring Development. We have changed the way Pandora FMS scans network elements and now Discovery is smarter and discovers many more elements automatically.

Elastic's Guide to Keeping Services up and Running with Real-time Visibility

Learn how to start monitoring in minutes, keep your networks up and running, and make sure citizens have continuous access to digital portals and services. Increased traffic. New users on the network. Data sharing at unprecedented levels. Meet all the challenges coming your way with the free and open Elastic Stack.

How isolation improves queries in Prometheus 2.17

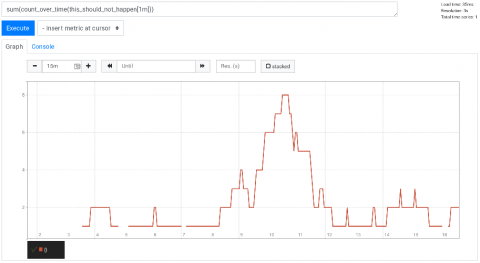
There are instances in life when isolation is actually welcome. One of those instances pertains to the I in the acronym ACID, which outlines the key properties necessary to maintain the integrity of transactions in a database. The time series database (TSDB) embedded in the Prometheus server has the C (consistency), the D (durability), and – somewhat debatable – the A (atomicity). But up until and including Prometheus v2.16, it did not have the I (isolation).